Asian Indices:
- Australia’s ASX 200 index rose by 23.5 points (0.34%) and currently trades at 6,977.70
- Japan’s Nikkei 225 index has fallen by -80.73 points (-0.26%) and currently trades at 30,994.67
- Hong Kong’s Hang Seng index has fallen by 0 points (0%) and currently trades at 17,485.98
- China’s A50 Index has fallen by -129.62 points (-1.05%) and currently trades at 12,268.43
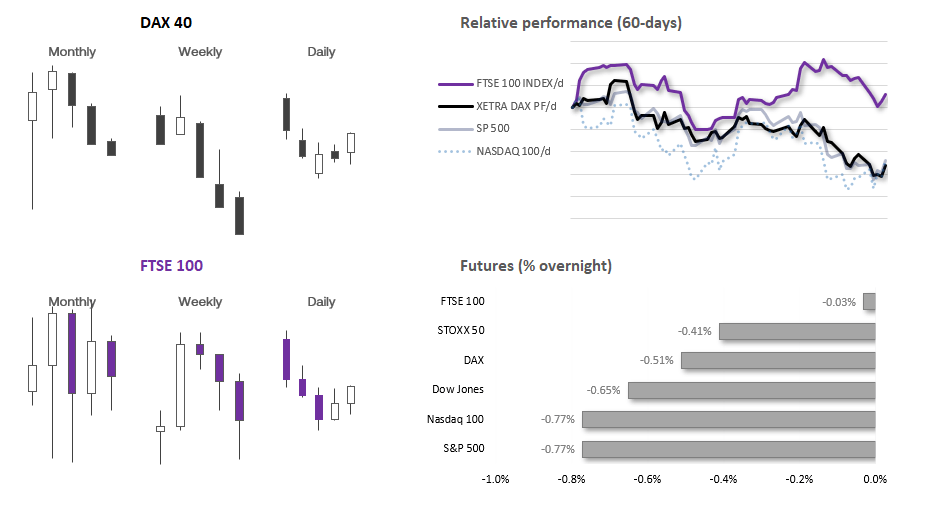
UK and Europe:
- UK’s FTSE 100 futures are currently down -2 points (-0.03%), the cash market is currently estimated to open at 7,492.58
- Euro STOXX 50 futures are currently down -17 points (-0.41%), the cash market is currently estimated to open at 4,127.43
- Germany’s DAX futures are currently down -78 points (-0.51%), the cash market is currently estimated to open at 15,151.77
US Futures:
- DJI futures are currently down -220 points (-0.65%)
- S&P 500 futures are currently down -34.25 points (-0.79%)
- Nasdaq 100 futures are currently down -119 points (-0.79%)
Gold and oil were higher in Monday’s Asian session in response to weekend news that Iran had declared war against Hamas. With the potential that this could spread into a wider Middle East conflict, gold sucked in safe haven flows whilst oil was higher on supply concerns. Stock market index futures are lower to point a slight risk-off tone at the beginning of the week.
Gold has regained its safe-haven status following the geopolitical events over the weekend. Although we warned last week that its downside move was overstretched, and $1800 could be a tough level to break. From here we prefer to buy dips and see the potential for gold to head for $1880, but unless we see bond yields move materially lower then I doubt it can break $1900 any time soon. Of course, should geopolitical tensions abate then gold will look very appealing to bearish eyes, with 1850 and 1880 making likely resistance levels for bears to fade into.
It’s also worth noting that managed funds flipped to net-short exposure to gold futures last week, and net-long exposure among large speculators fell to a 47-week low. So any bounce on gold could be ‘short’ lived, as its current rally is fuelled by safe-haven demand.
Events in focus (GMT+1):
- Public holiday in Canada
- 07:00 – German industrial production
- 09:30 – EU Sentix investor confidence
- 14:00 – Fed Logan speaks
- 14:15 – Fed Vice Chair for Supervision Barr speaks
- 15:00 – US employment trends index
- 17:50 – Fed governor Jefferson speaks
- 21:00 – BOE MPC member Mann speaks
- 03:50 – Fed Governor Jefferson speaks
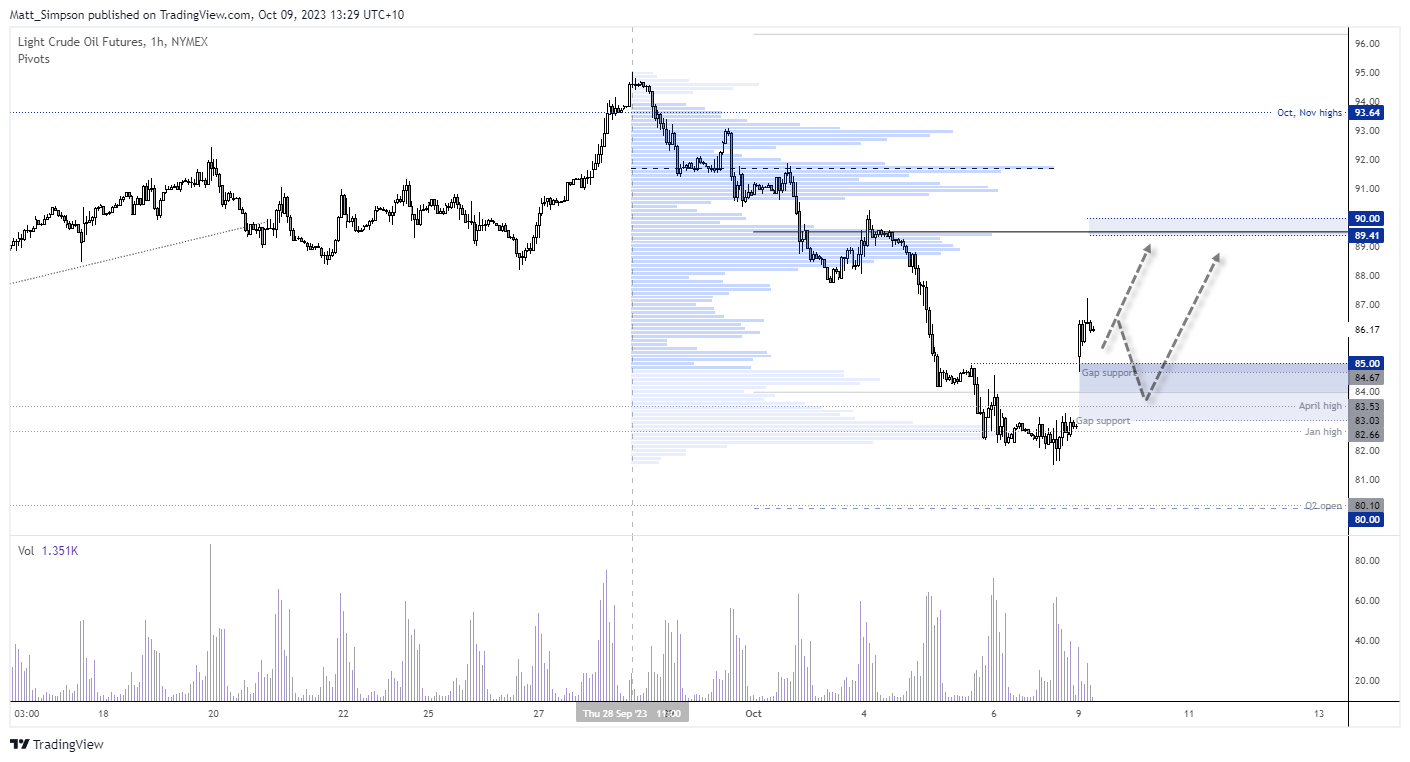
WTI crude oil technical analysis (1-hour chart):
Oil prices gapped higher, which saw WTI crude oil rise just under 3% from Friday’s close. Whilst it continued to advance and rose over 5%, prices have since pulled back after WTI formed a bearish pinbar on the 1-hour chart. From here, I’m waiting to see if prices pull back to try and fill the gap – and then will be seeking evidence of a swing low to suggest its next leg higher is underway. $89 seems like a viable target, given the monthly pivot point and volume node reside just beneath the $90 level.
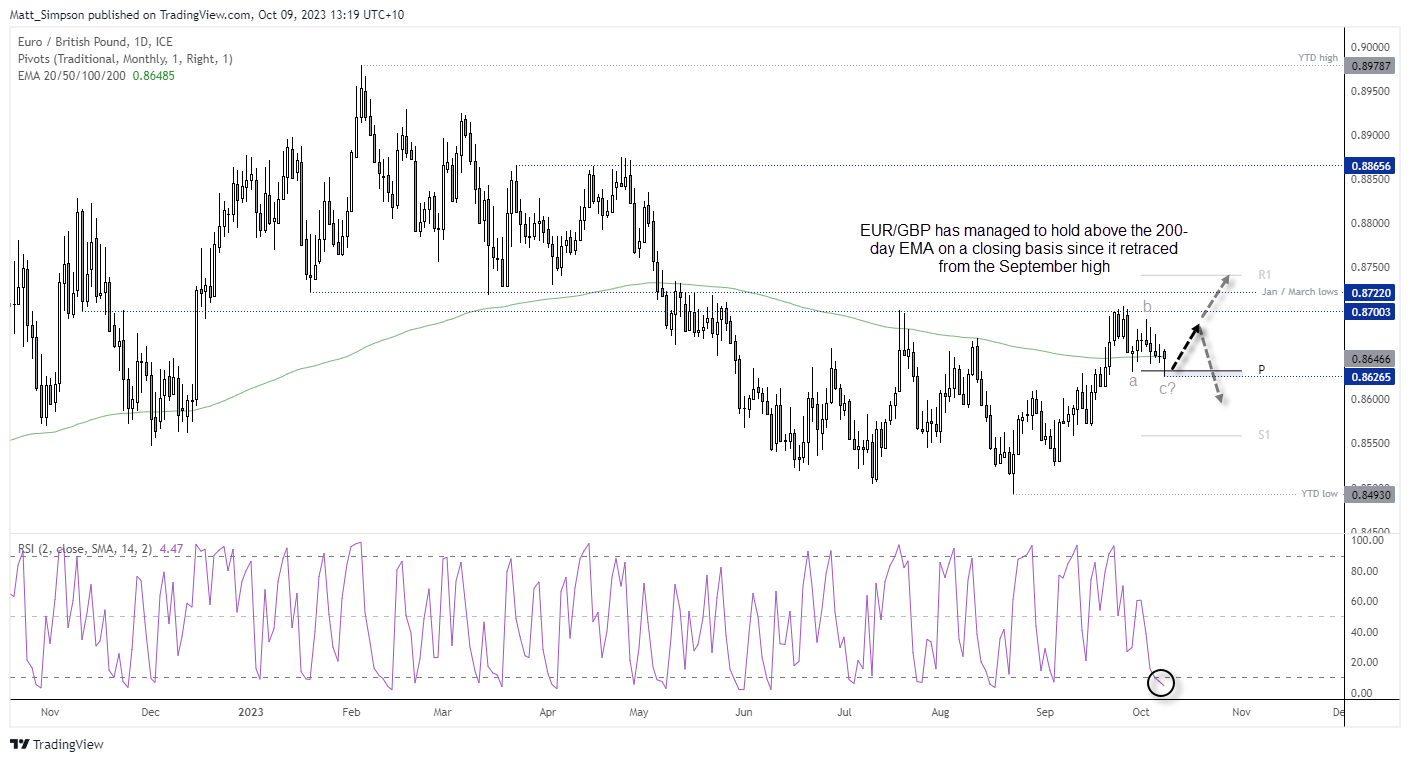
EUR/GBP technical analysis (daily chart):
Price action on EUR/GBP has caught my eye, as an apparent 3-wave move is refusing to close the day beneath the 200-day EMA. The pair briefly traded to a 1-day low after the Asian open, but once again prices have recovered back to that average. And as the RSI (2) is within the oversold level, I’m now looking for another leg higher. Whether it can break to a new cycle high remains to be seen, although 0.8700 makes a viable resistance level over the near-term.
From time to time, StoneX Financial Pty Ltd (“we”, “our”) website may contain links to other sites and/or resources provided by third parties. These links and/or resources are provided for your information only and we have no control over the contents of those materials, and in no way endorse their content. Any analysis, opinion, commentary or research-based material on our website is for information and educational purposes only and is not, in any circumstances, intended to be an offer, recommendation or solicitation to buy or sell. You should always seek independent advice as to your suitability to speculate in any related markets and your ability to assume the associated risks, if you are at all unsure. No representation or warranty is made, express or implied, that the materials on our website are complete or accurate. We are not under any obligation to update any such material.
As such, we (and/or our associated companies) will not be responsible or liable for any loss or damage incurred by you or any third party arising out of, or in connection with, any use of the information on our website (other than with regards to any duty or liability that we are unable to limit or exclude by law or under the applicable regulatory system) and any such liability is hereby expressly disclaimed.