WTI Technical Analysis Summary
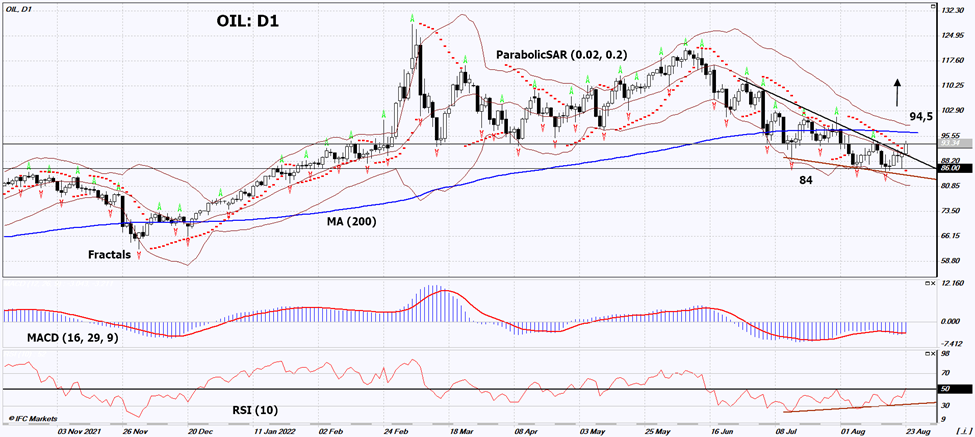
Buy Stop։ Above 94,5
Stop Loss: Below 84
| Indicator | Signal |
|---|---|
| RSI | Buy |
| MACD | Buy |
| MA(200) | Neutral |
| Fractals | Neutral |
| Parabolic SAR | Buy |
WTI Chart Analysis
WTI Technical Analysis
On the daily timeframe, OIL: D1 went up from the triangle. A number of technical analysis indicators formed signals for further growth. We do not rule out a bullish movement if OIL: D1 rises above the last up fractal: 94.5. This level can be used as an entry point. The initial risk limit is possible below the Parabolic signal and the last lower fractal: 84. After opening a pending order, we move the stop following the Bollinger and Parabolic signals to the next fractal low. Thus, we change the potential profit/loss ratio in our favor. The most cautious traders, after making a trade, can switch to a four-hour chart and set a stop loss, moving it in the direction of movement. If the price overcomes the stop level (84) without activating the order (94.5), it is recommended to delete the order: there are internal changes in the market that were not taken into account.
Fundamental Analysis of Commodities - WTI
OPEC+ may cut production if Iran increases oil production. Will the OIL quotes continue to increase ?
Opinion was expressed by Abdulaziz bin Salman (Minister of Energy of Saudi Arabia) regarding the information about a possible mitigation of Iran’s demands (position) during negotiations with Western countries on the “nuclear deal”. The next OPEC+ meeting is scheduled for September 5, 2022. It should be noted that OPEC+ production in July was already 2.89 million barrels per day (bpd) less than previously approved quotas. This was mainly due to Western economic sanctions against Russia. A significant factor in the rise in oil prices may be its use for heating and power generation in European countries against the backdrop of rising natural gas prices on August 22, 2022 to $3,000 per thousand cubic meters (according to the Title Transfer Facility).