XAUUSD (Gold) formed a secondary peak at 1593.82 on February 2, 2020 and turned lower sharply. Primary count suggests secondary peak completed wave B as a FLAT and wave C lower has started which should form part of a Zigzag Elliott wave structure down January 7, 2020 peak. A zigzag is a 5-3-5 structure in which both wave A and C are in 5 waves or 5 swings. Therefore, wave C should either unfold as an impulse or a diagonal. In the chart below, we take a look at the current short-term view of Gold.
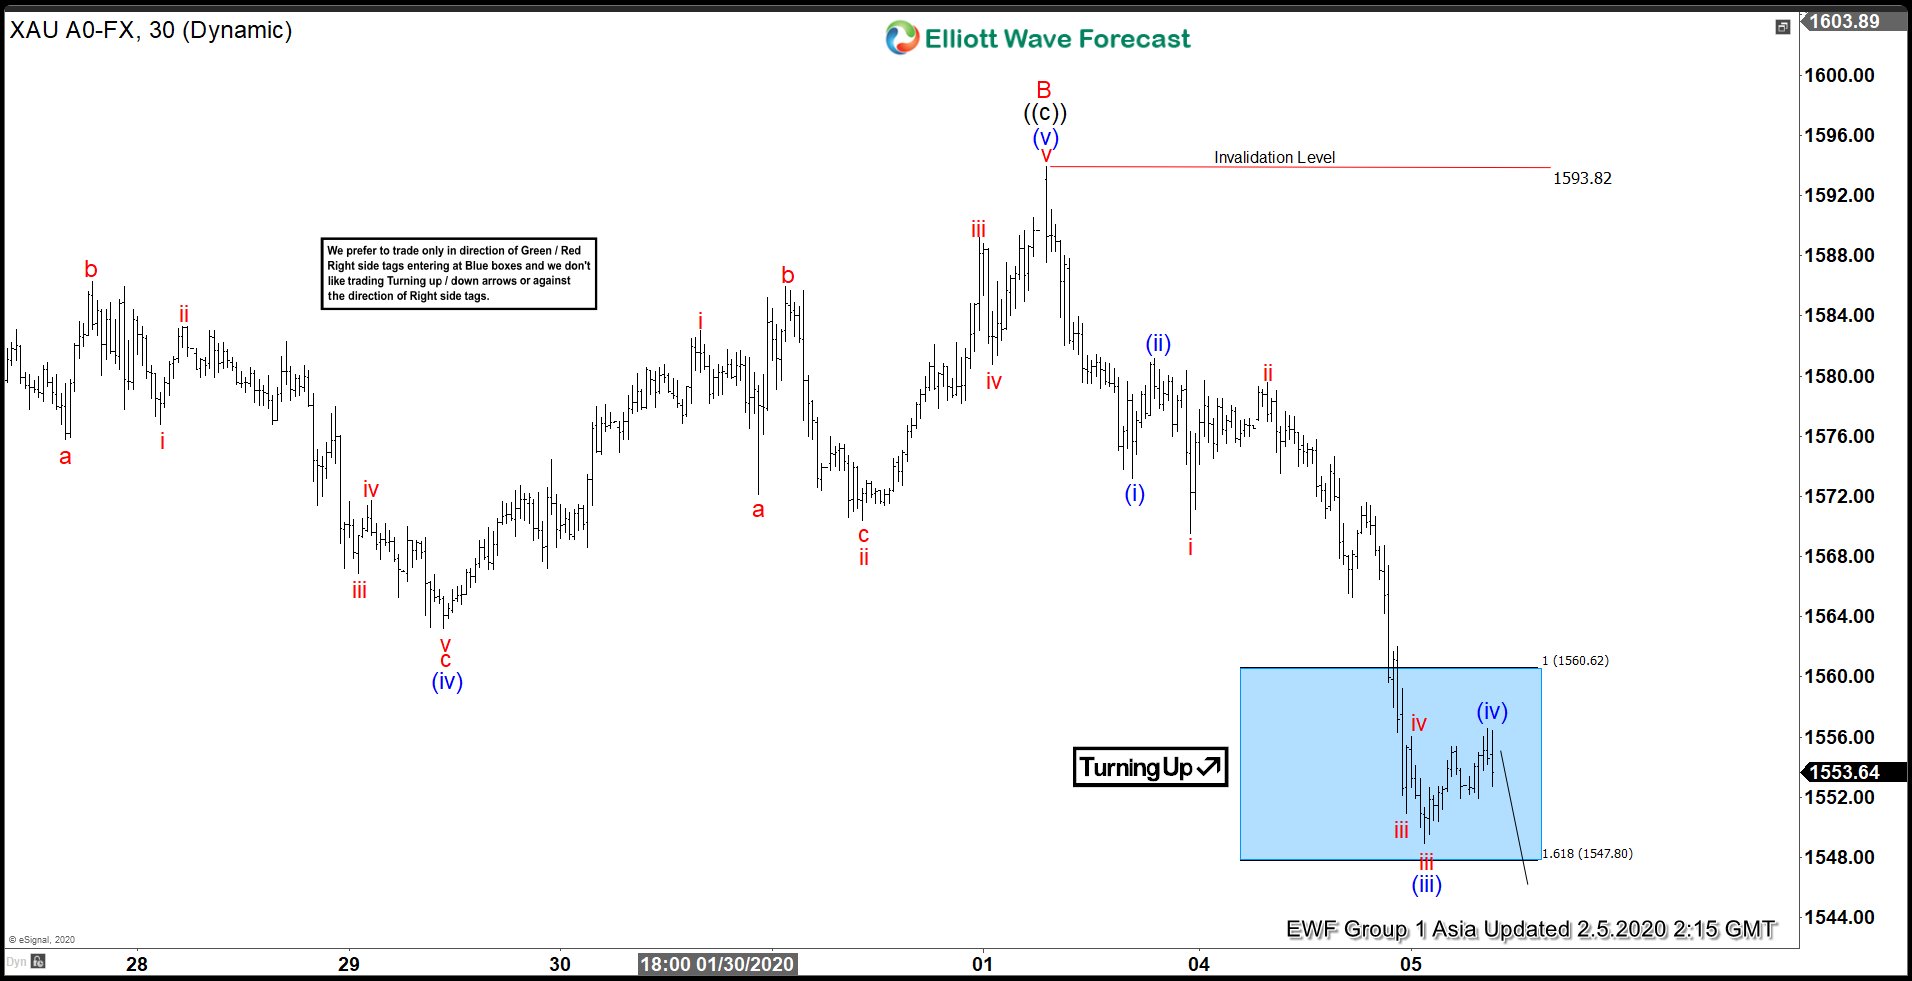
XAUUSD Short-term Elliott Wave Analysis 2.5.2020
Chart below shows initial decline from 1593.82 peak was in 5 waves which ended at 1573.22 and completed wave (i) of ((i)) of C. Bounce to 1581.19 complete wave (ii) which was followed by some sideways consolidation and then a sharp decline which ended at 1548.90 and is proposed to have completed wave (iii). Bounce to 1556.59 is proposed to be a wave (v) and a drop to new lows. Even though it’s not shown on the chart because it’s an intra-day chart, expectations are for the new low to be wave (v) which should complete wave ((i)) of C before we get a bounce in wave ((ii)) of C to correct the decline from 1593.82 peak and continue lower in wave C provided the peak at 1593.82 remains intact during proposed wave ((ii)) bounce. As far as 1593.82 high stays in place, wave C should ideally extend lower toward 1522.05 - 1477.87 area. In case the bounce extends, then we should still be in wave (iv) and could see 1560.14 - 1564.80 area before it turns lower in proposed wave (v).