In this technical blog, we will look at the past performance of 4 hour Elliott Wave Charts of XLI, which we presented to members at the elliottwave-forecast. In which, the rally from 23 March 2020 low unfolded as an impulse structure. And showed a higher high sequence favored more upside extension to take place. Therefore, we advised members not to sell the ETF & buy the dips in 3, 7, or 11 swings at the blue box areas. We will explain the structure & forecast below:
XLI 4 Hour Elliott Wave Chart
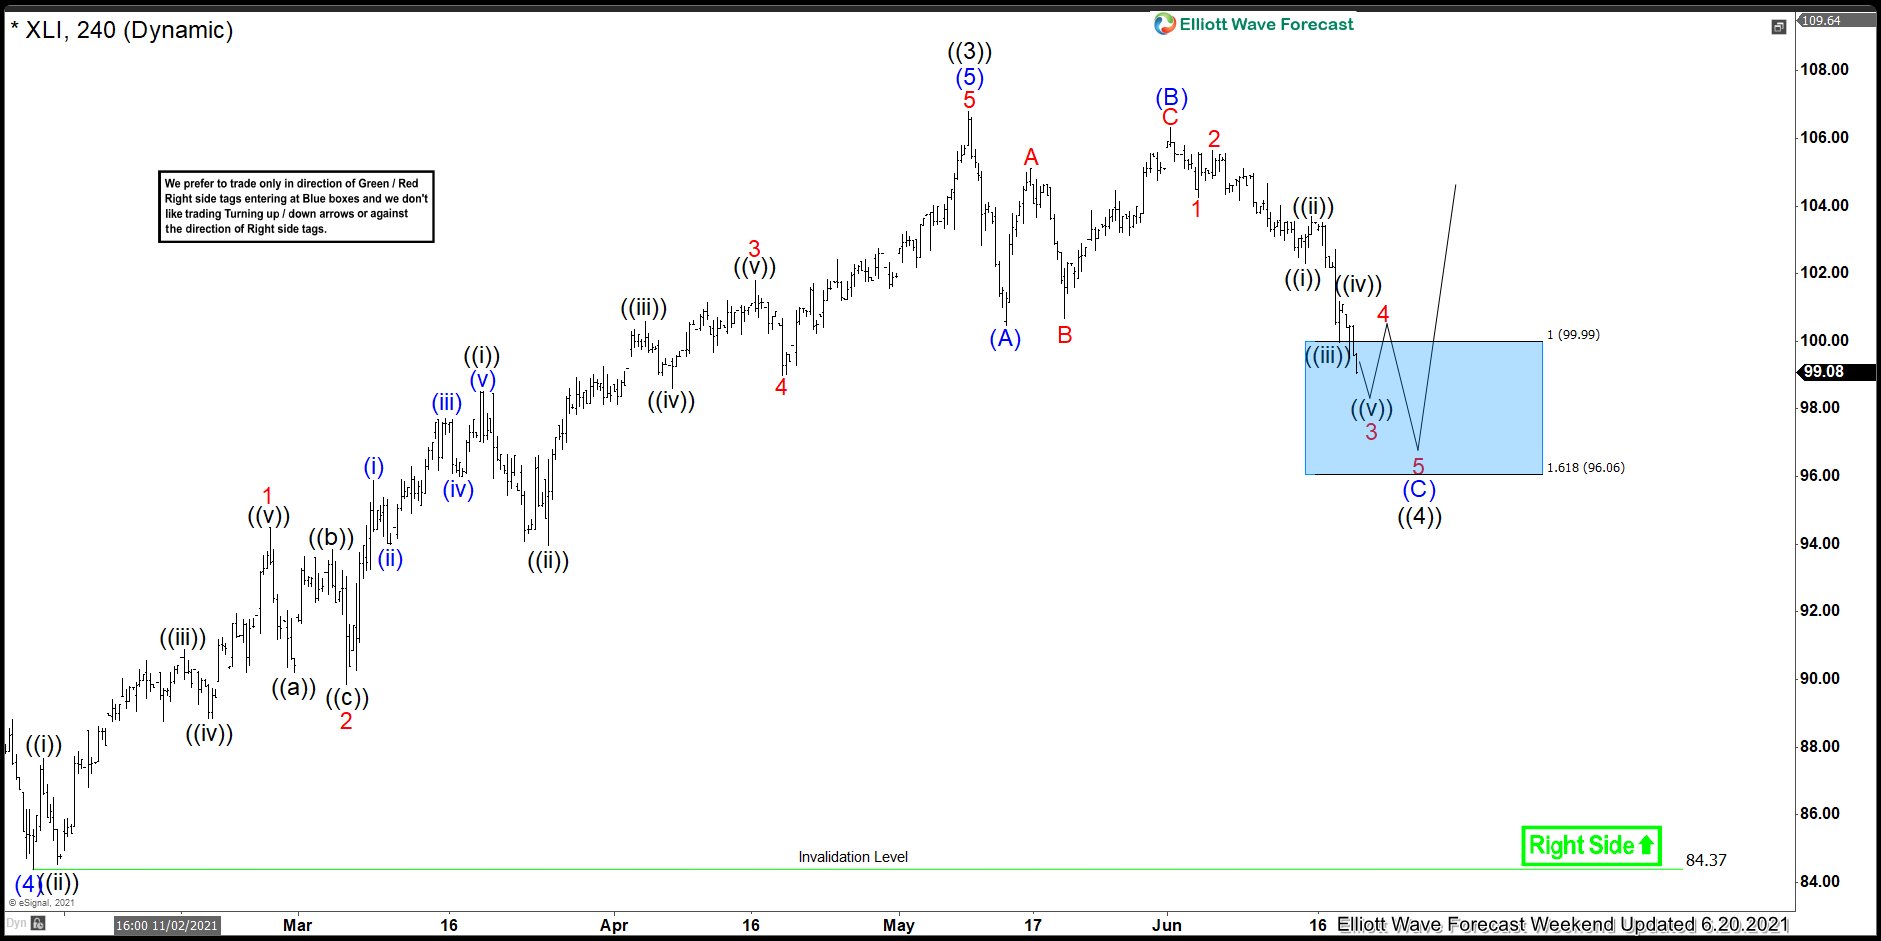
Above is the 4 Hour Elliott wave chart from the 6/20/2021 update. In which, the XLI is showing an impulse rally higher where wave (4) ended at $84.37 low. Up from there, wave (5) ended at $106.81 high and thus completed the bigger wave ((3)). Down from there, the ETF entered in wave ((4)) pullback to correct the cycle from 9/24/2020 low. The internals of that pullback unfolded as Elliott wave zigzag structure where wave (A) ended at $100.46 low. Wave (B) bounce ended at $106.31 high as a flat structure and wave © managed to reach $99.99- $96.06 blue box area. From where buyers were expected to appear looking for more upside or for a 3 wave bounce at least.
XLI Latest 4 Hour Elliott Wave Chart
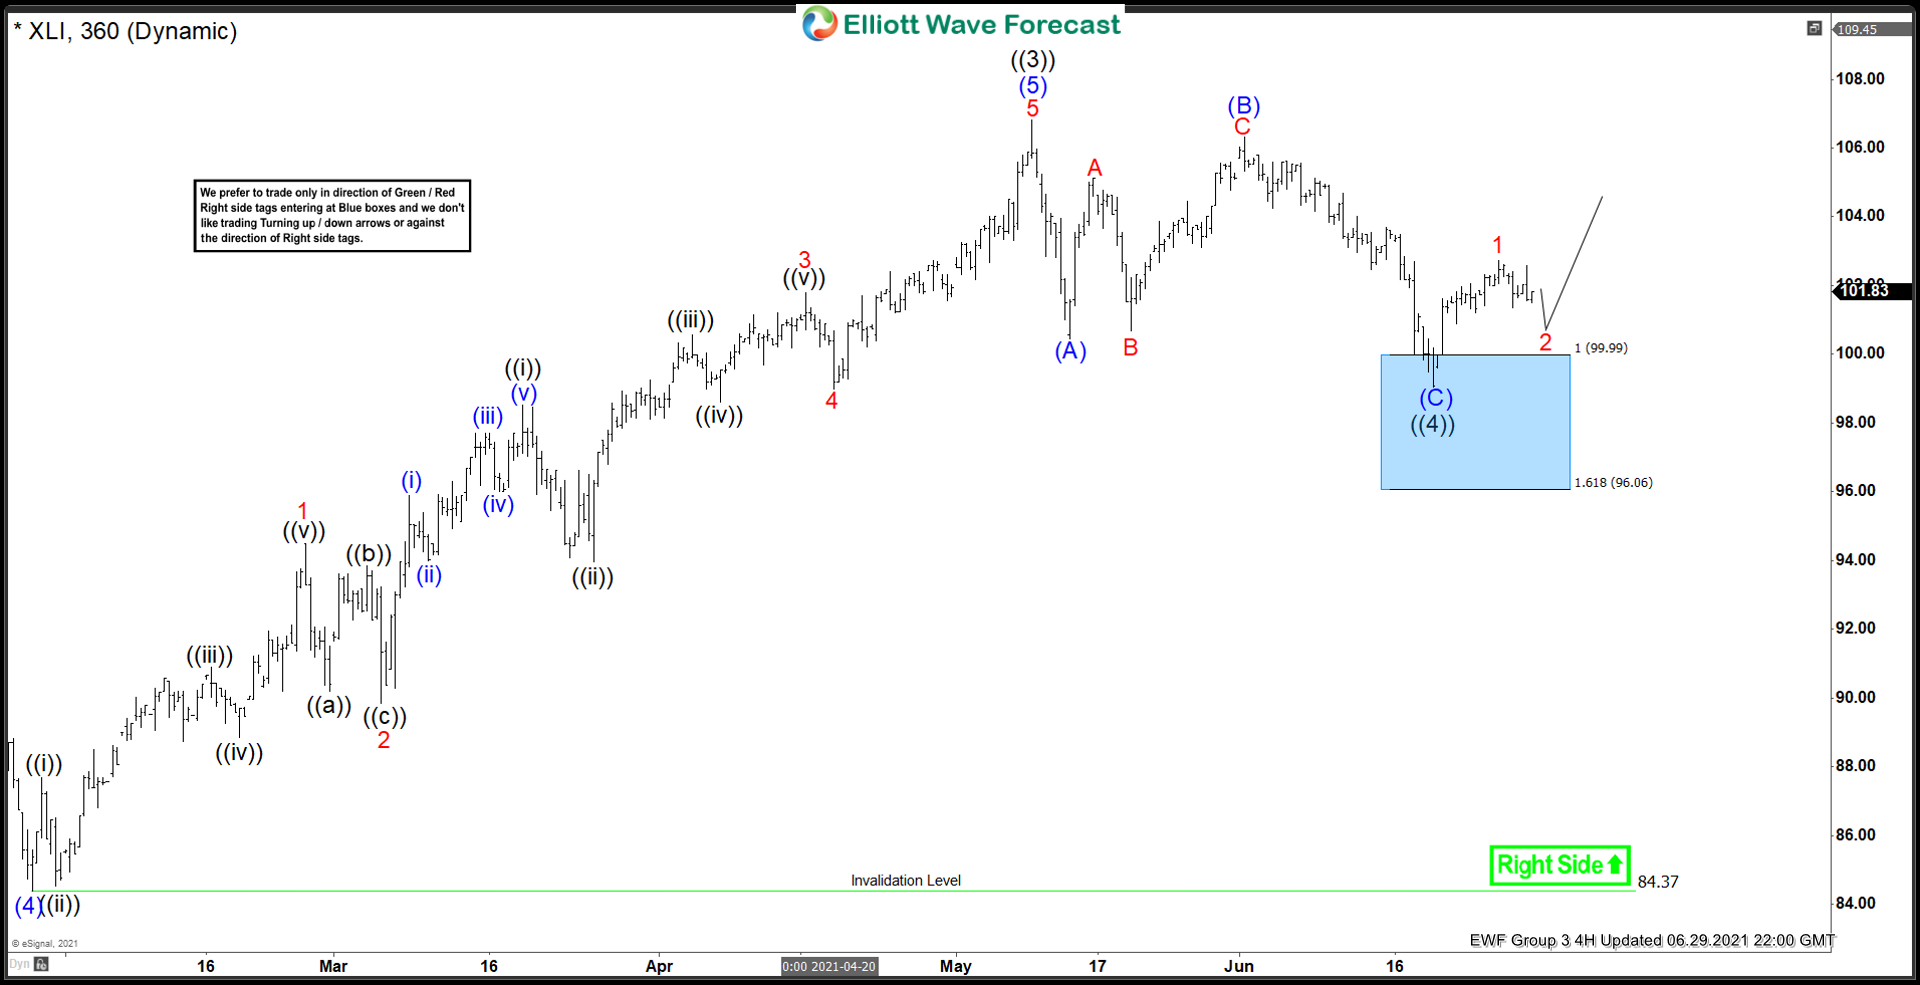
Here’s the latest 4hr Elliott wave Chart of XLI from the 6/29/2021 update. In which the stock is showing a reaction higher taking place from the blue box area. Right after ending the zigzag correction within the blue box area. Allowed members to create a risk-free position shortly after taking the long positions at the blue box area. However, a break above $106.81 high still needed to confirm the next extension higher & avoid double correction lower.
Source: XLI Can Resume The Rally From Elliott Wave Blue Box Area