XLY – Don’t Count the American Consumer Out Yet

The U.S. Consumer Measured Via the XLY

“The U.S. economy is the global economic driver. And within the U.S. economy, the U.S. consumer is the global driver.” James P. Gorman

We’re Entering In Negative Territory for 2018

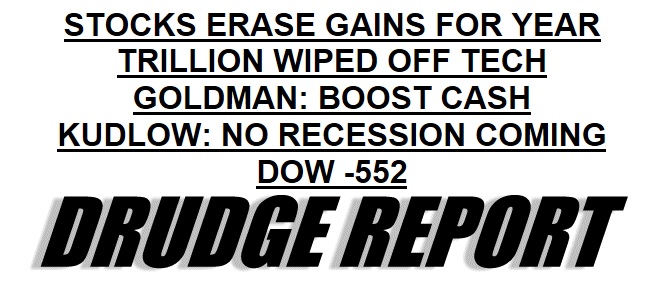
The stock market (measured via the S&P 500 and Dow Jones Industrial Average) has officially erased all of its 2018 gains. I can see from the headlines like the one pictured below from The Drudge Report that there’s certainly starting to be a bit of panic in the air.

The Parts of the Machine Matter

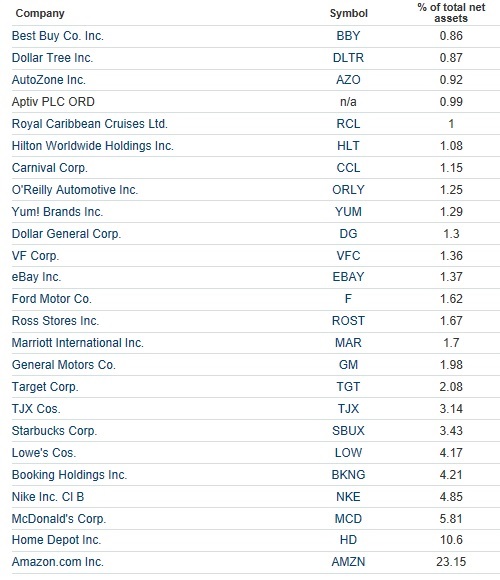
One of the beneficiaries of this year’s market rise was the Consumer Discretionary Sector E T F , XLY as it still remains above its 2018 low near 98 with a price currently near 101. The main reason for XLY’s rise was due to Amazon’s 23.15% weighting in the E T F and the fact that even with the recent downturn in AMZN it is still well above its 2018 low. You can see below that AMZN dwarfs its nearest XLY weighted fellow component, HD (10.6%), by over 2 to 1. Behind HD nothing comes close in terms of comparable influence upon XLY.

What are We Expecting for XLY Going Into the Holiday Shopping Season?
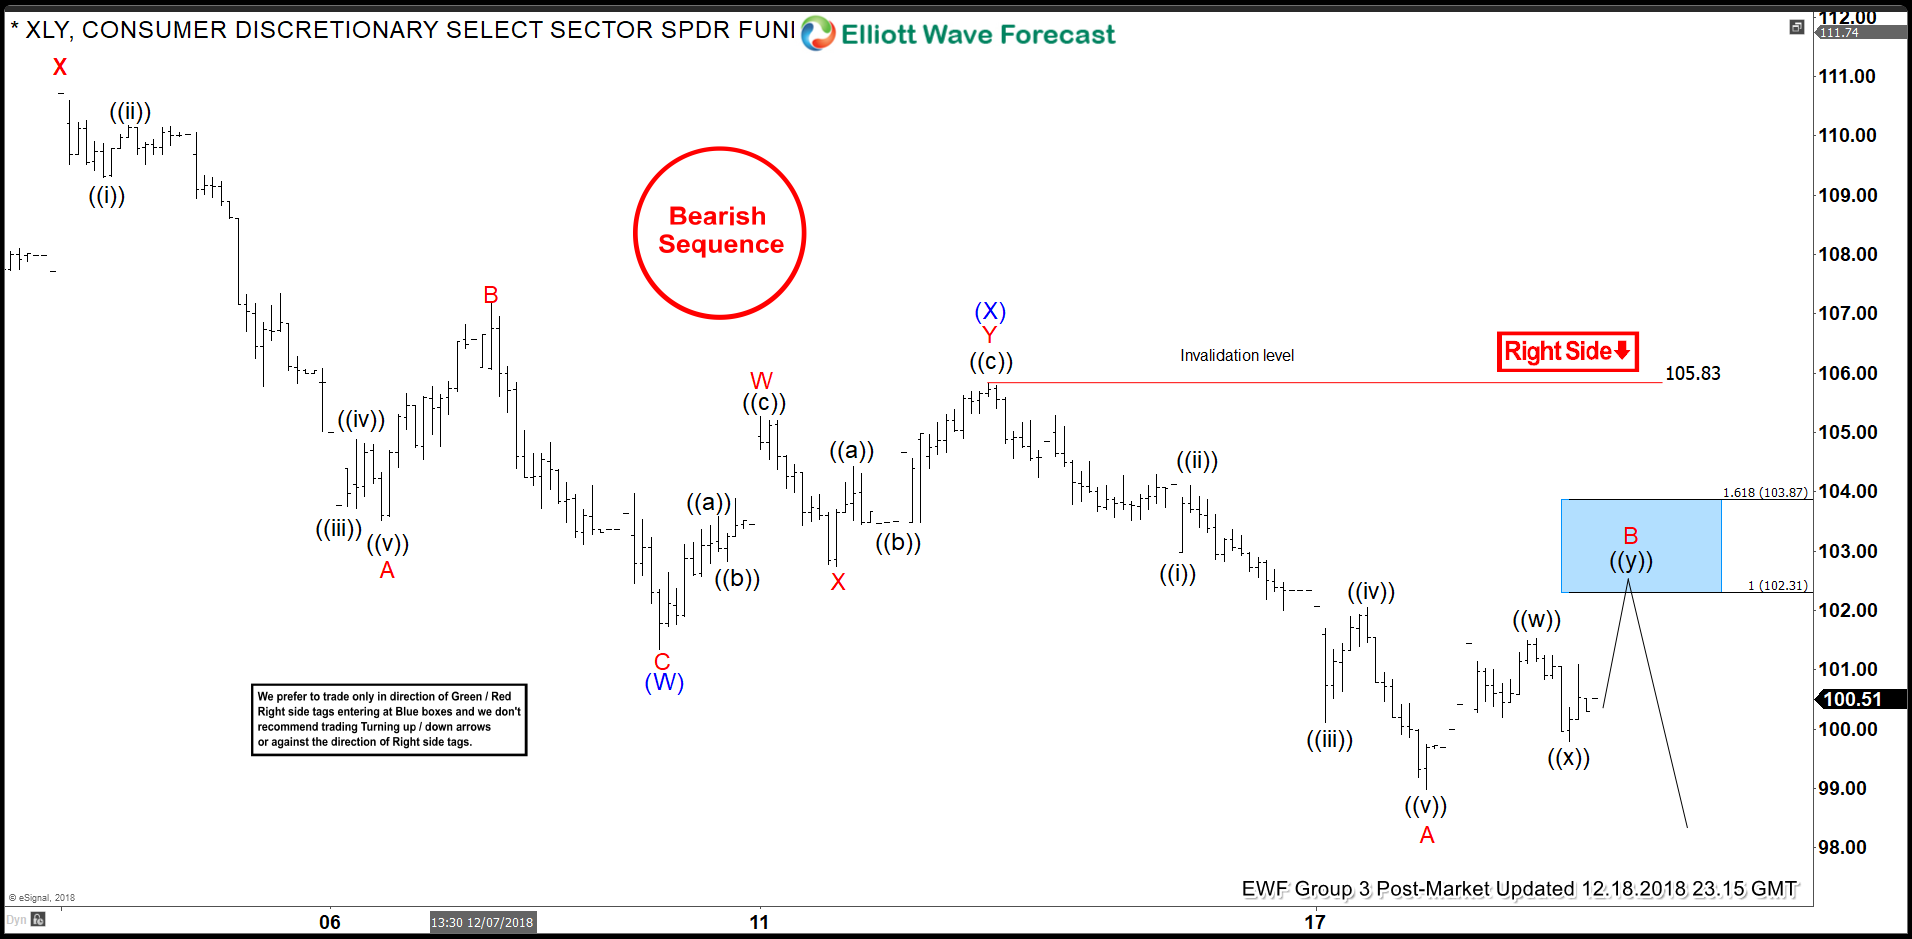
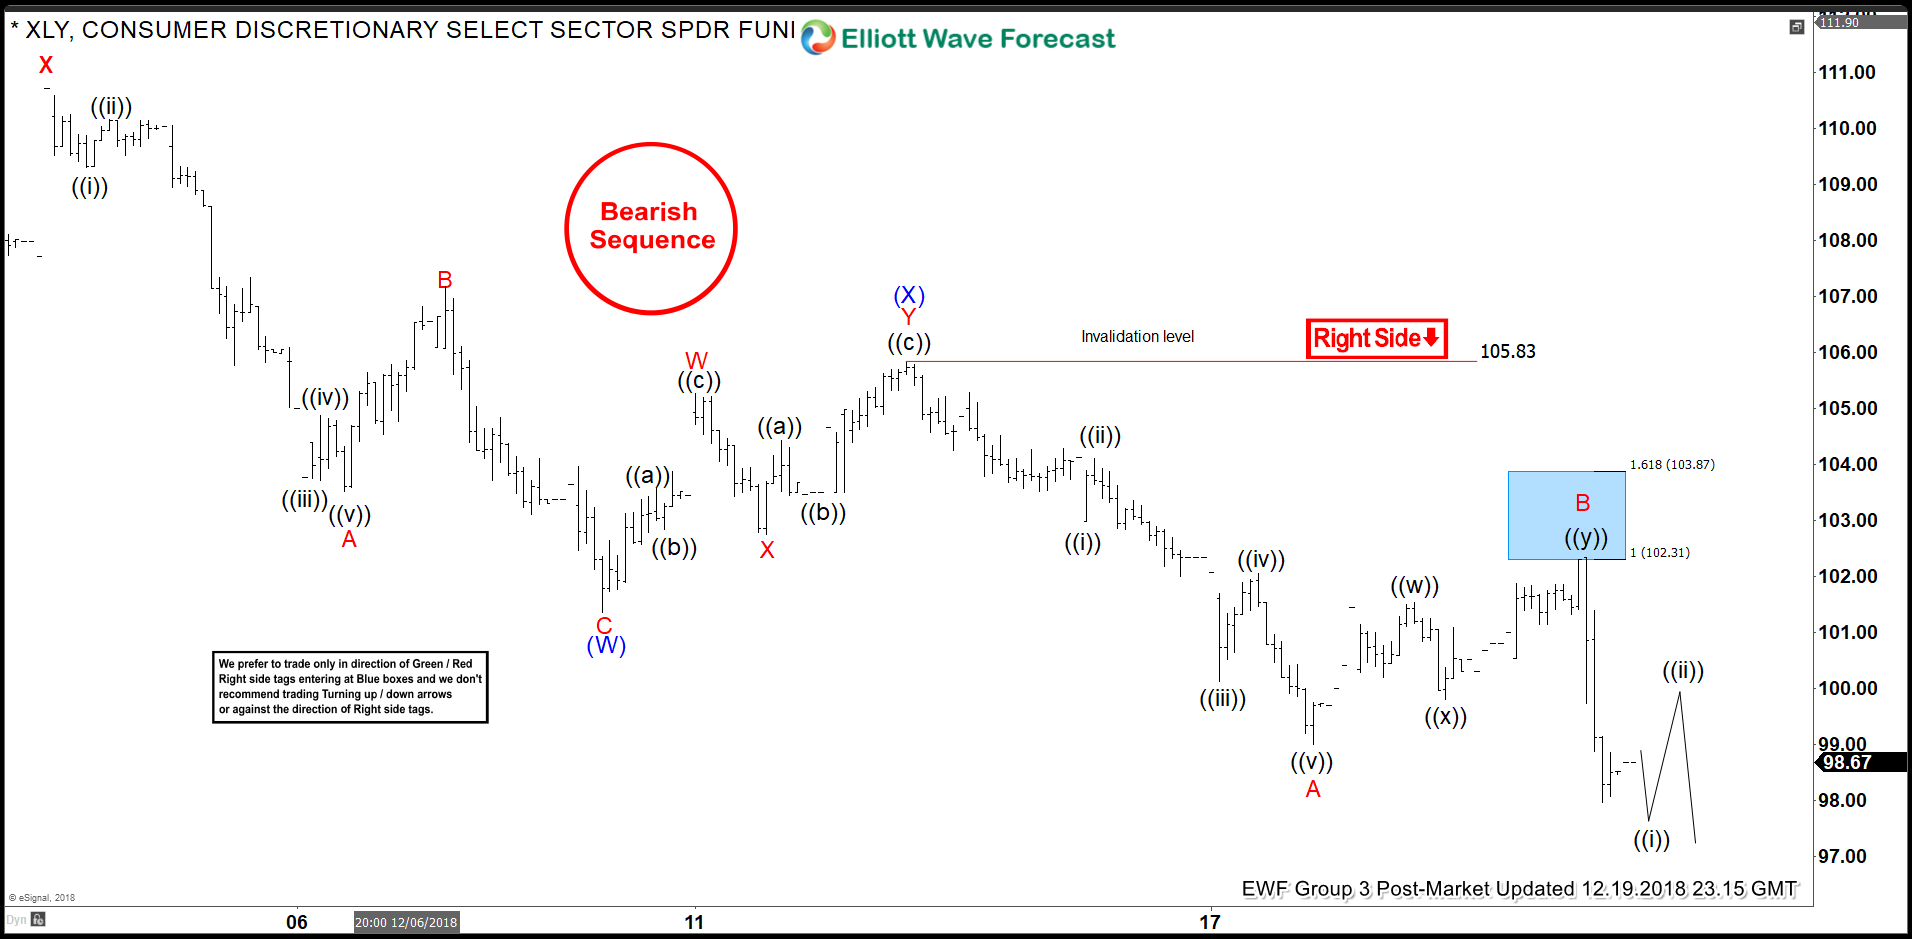
XLY has just now confirmed that the E T F is headed lower along side AMZN. You can see in the chart below that the most recent proposed wave count suggest that this bearish price action is merely a correction. The larger trend is indeed bullish. But, in the meantime, there exists the similarity with AMZN that traders can expect more tradable downside in the near term.

The Wave Count for XLY

The cycle from XLY’s 2009 low (15.72) remains in progress as an impulse structure, where Super Cycle degree wave (I) ended in 5 waves at 80.61 while Super Cycle degree wave (II) ended as a Flat at 67.07 on 2/11/2016 low.

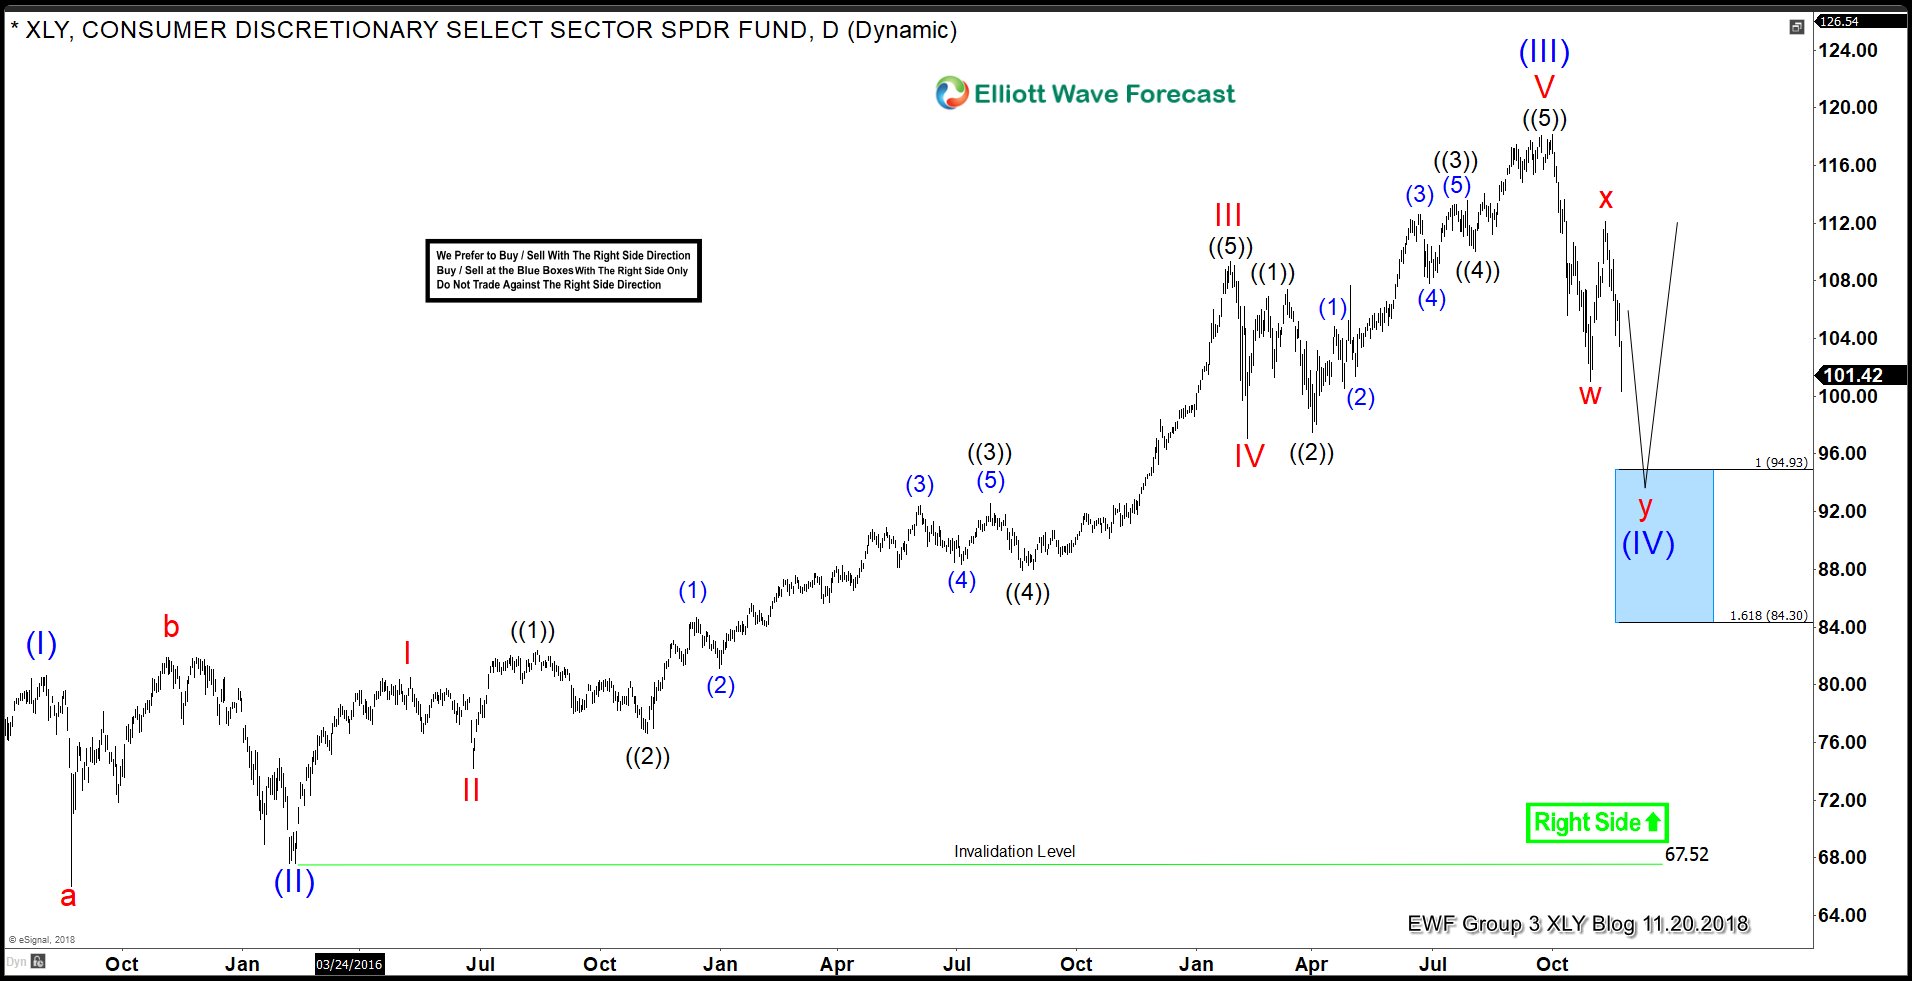
Currently, it has ended the cycle from the 2/11/2016 low in Super Cycle degree wave (III) at the 118.26 high. Coming down from there XLY is remains correcting the aforementioned cycle in a Super Cycle degree wave (IV) pullback as a double three structure consisting of Cycle degree waves w - x - y. In the near term while the 112.15 Cycle degree x wave high of 11/08/2018 holds expect lower prices to target the extreme equal leg and extension area of 95-84.

James EWF Analytical Team

Technical based traders using EWF’s Blue Box System on 12/19/2018 executed a near perfect entry short in the Consumer Discretionary ETF - XLY before the FOMC rate decision. Prior to the actual trigger of the trade, Elliottwave-Forecast analysis showed our Group 3 Membership the ideal entry range. It is in these ranges of symmetrical extremes where highly probable directional reactions most often take place. And, like the reaction we see in XLY, continue to confirm our method of sequence analysis.

This system we use is incumbent upon trading in what we dub “The Right Side”. Using our proprietary sequence and cycle analytical system we determine first if there is a bearish or bullish sequence present. Once a sequence has been established we determine if the cycle is incomplete. If incomplete then we have a trading opportunity at the next corrective swing against the direction of the cycle. A trading entry is then mapped and planned at the extreme area. The formulated invalidation level must remain intact to keep our traders on the correct side of the market.

The 12/18/2018 Post Market Chart Setup for XLY

Over the years we’ve learned to trust what the charts are telling us versus chasing a fundamental event. The chart above highlights our intended selling range in blue. This area is where we would sell any 3, 7, or 11 “swings” back higher while prices remain below 105.83. Going in the trading session we already had a plan regardless of how the market interpreted the language of the FOMC.

On December 18th we issued recommendations to sell short XLY at 102.25 just before the 102.30 – 103.87 range to ensure all Members could participate regardless of their respective broker’s spread. Pre-Market, December 19th, in our Daily Group 3 Live Analytical and Trading Session we suggested XLY should melt up into the FOMC rate decision and trigger our shorts.

The 12/19/2018 Post Market Chart of XLY After The FOMC

The post-market chart above shows what happened to prices of XLY at the blue box. Prices hit a high of 102.33 on 12/19/2018 at 2:01 PM EST and instantly fell to 99.73 before briefly bouncing. The 102.25 entry was never more than a mere 0.08 negative and our traders were able to remove risk on the trade by 2:45 PM EST.

Wishing you a very Merry Holiday Season,

James

EWF Analytical Team