In this technical blog, we are going to take a look at the past performance of 1 hour Elliott Wave Charts of the Exxon Mobil ticker symbol: XOM. In which, the decline from 08 June 2020 peak unfolded as an impulse 5 wave structure. Thus suggested that it’s a continuation pattern. And as per Elliott wave theory after a 3 waves pullback, it should do another extension higher in 5 waves impulse structure at least. Therefore, we advised members not to buy the instrument & trade the no enemy areas ( blue boxes) as per the Elliott wave hedging tool. Looking for 3 wave reaction lower at least. We will explain the structure & forecast below:
XOM 1 Hour Elliott Wave Chart
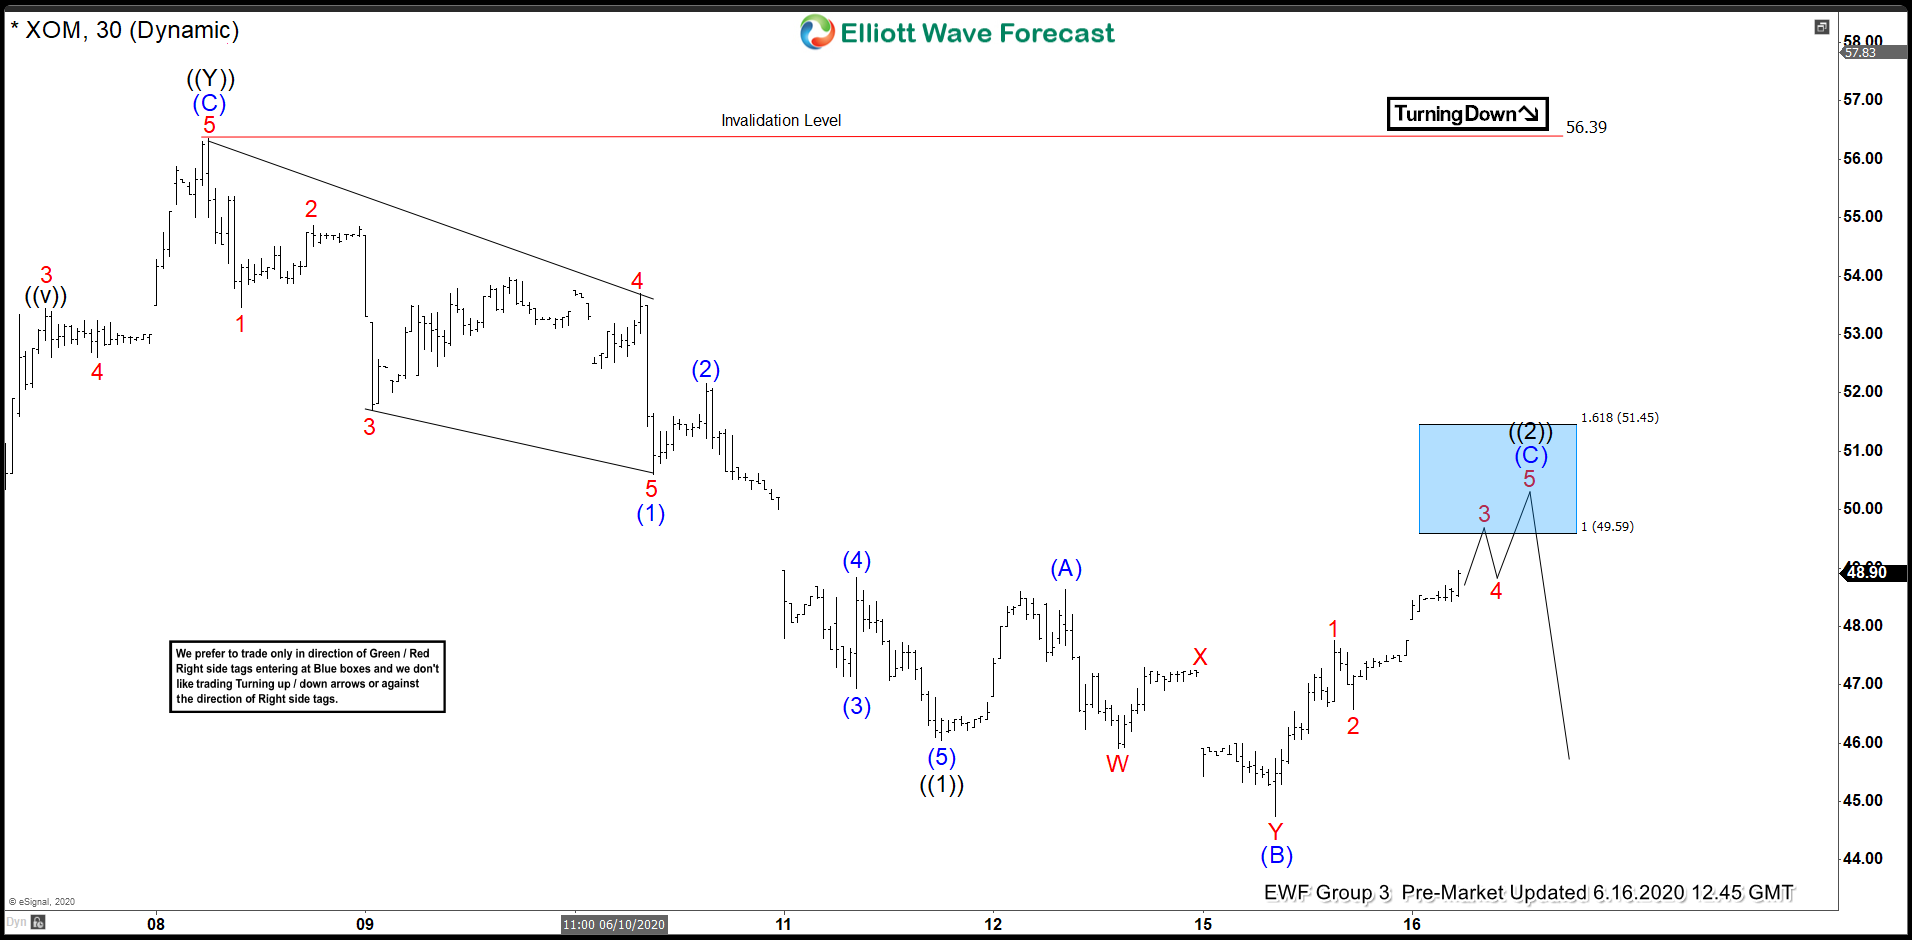
XOM 1 Hour Elliott Wave Chart from 6/16/2020 Pre-Market update. In which, the bounce to $56.39 high ended a cycle from March 2020 lows. Down from there, the decline unfolded as 5 waves impulse structure where wave (1) ended at $50.60 low. Wave (2) ended at $52.16 high, wave (3) ended at $46.93 low, wave (4) ended at $48.84 high, and wave (5) ended at $46.05 low. Above from there, the stock made a 3 wave bounce to correct the cycle from $56.39 high. The internals of that bounce unfolded as an Elliott Wave Flat structure where wave (A) ended at $48.62 high. Wave (B) ended at $44.75 and wave © was expected to reach $49.59- $51.45 100%-161.8% Fibonacci extension area of (A)-(B). From where sellers were expected to appear in the stock looking for another 5 waves lower or for 3 wave reaction lower at least.
XOM 1 Hour Elliott Wave Chart
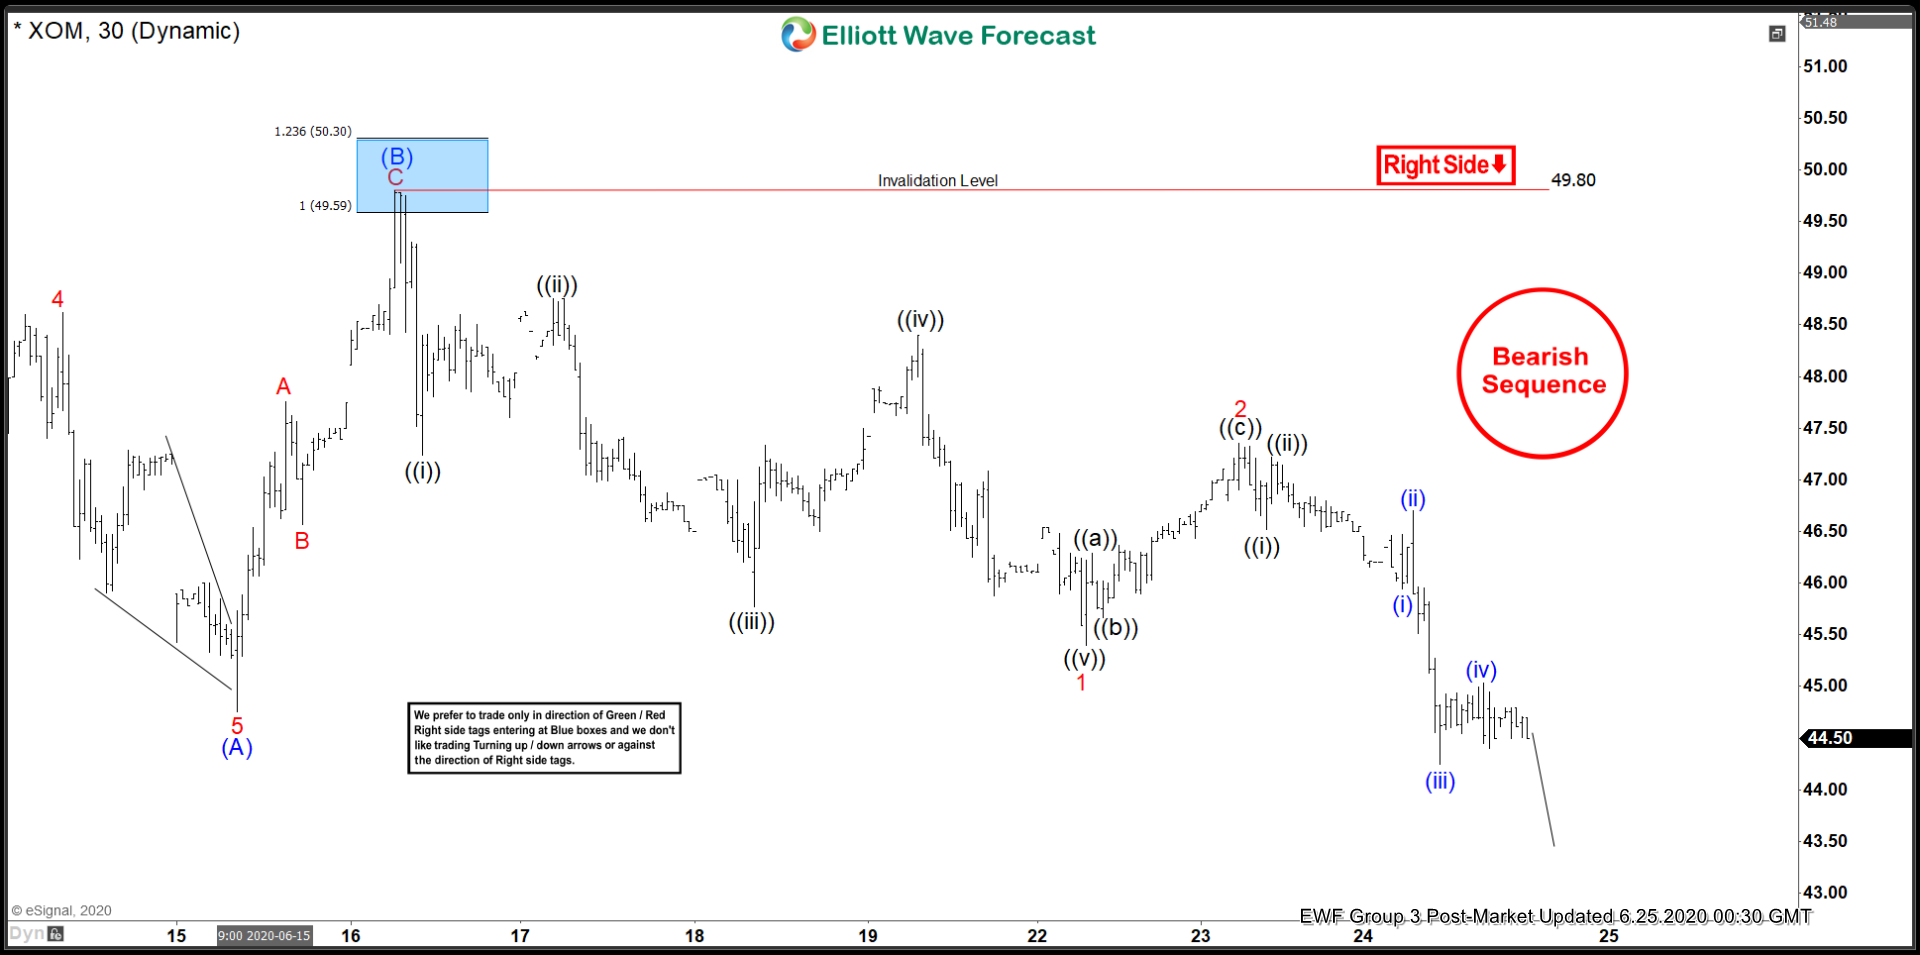
Here’s 1 Hour Elliott Wave Chart from 6/25/2020 Post-Market update. In which, the stock is showing strong reaction lower taking place from the blue box area. Allowed members to create a risk-free position shortly after taking the shorts at $49.59- $51.45 blue box area. It’s important to note that with further market data, we re-adjusted the count by downgrading the degree of labeling in 1 Hour Charts.