Another instrument that we have been trading lately is Exxon Mobil Corporation ( $XOM ) from Group 3. In this technical blog we’re going to take a quick look at the Elliott Wave charts of $XOM, published in members area of the website. As our members know, XOM has been showing incomplete impulsive sequences from the October 31.11 low. Consequently we were calling for more strength in the Stock, suggesting members to avoid selling it and keep favoring the long side. In further text we’re going to explain Elliott Wave Forecast and Trading strategy.
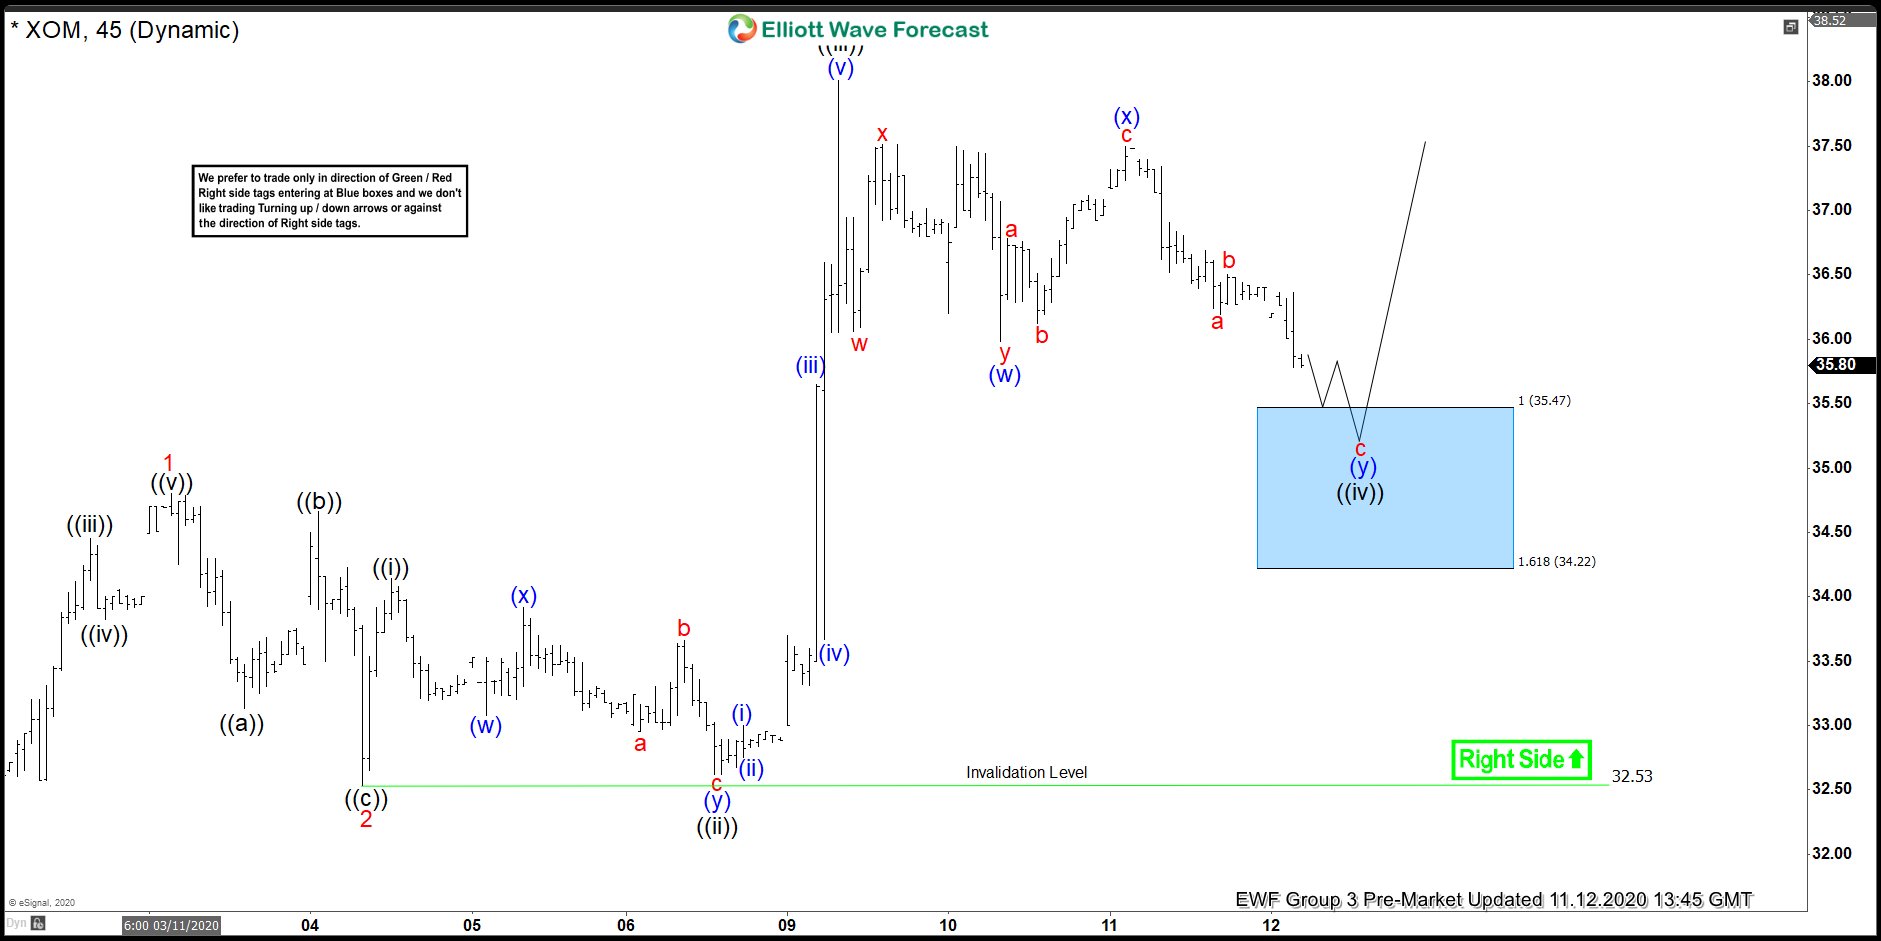
XOM 1 Hour Elliott Wave Analysis 11.12.2020
XOM is giving us pull back wave ((iv)) black that looks incomplete at this stage. We expect to see another leg down toward 35.47-34.22 ( buyers zone) . From marked Blue Box area area we expect rally to take us toward new highs ideally. As our members know Blue Boxes are no enemy areas , giving us 85% chance to get a bounce. We don’t recommend selling it. Strategy is buying the dips at the marked blue box area. As XOM is bullish against the 32.53 low , we expect to see 3 waves bounce at least from the mentioned zone. As soon as the price reach 50 Fibonacci Retracement against the (x) blue peak, we should make long positions Risk Free ( put SL at BE).
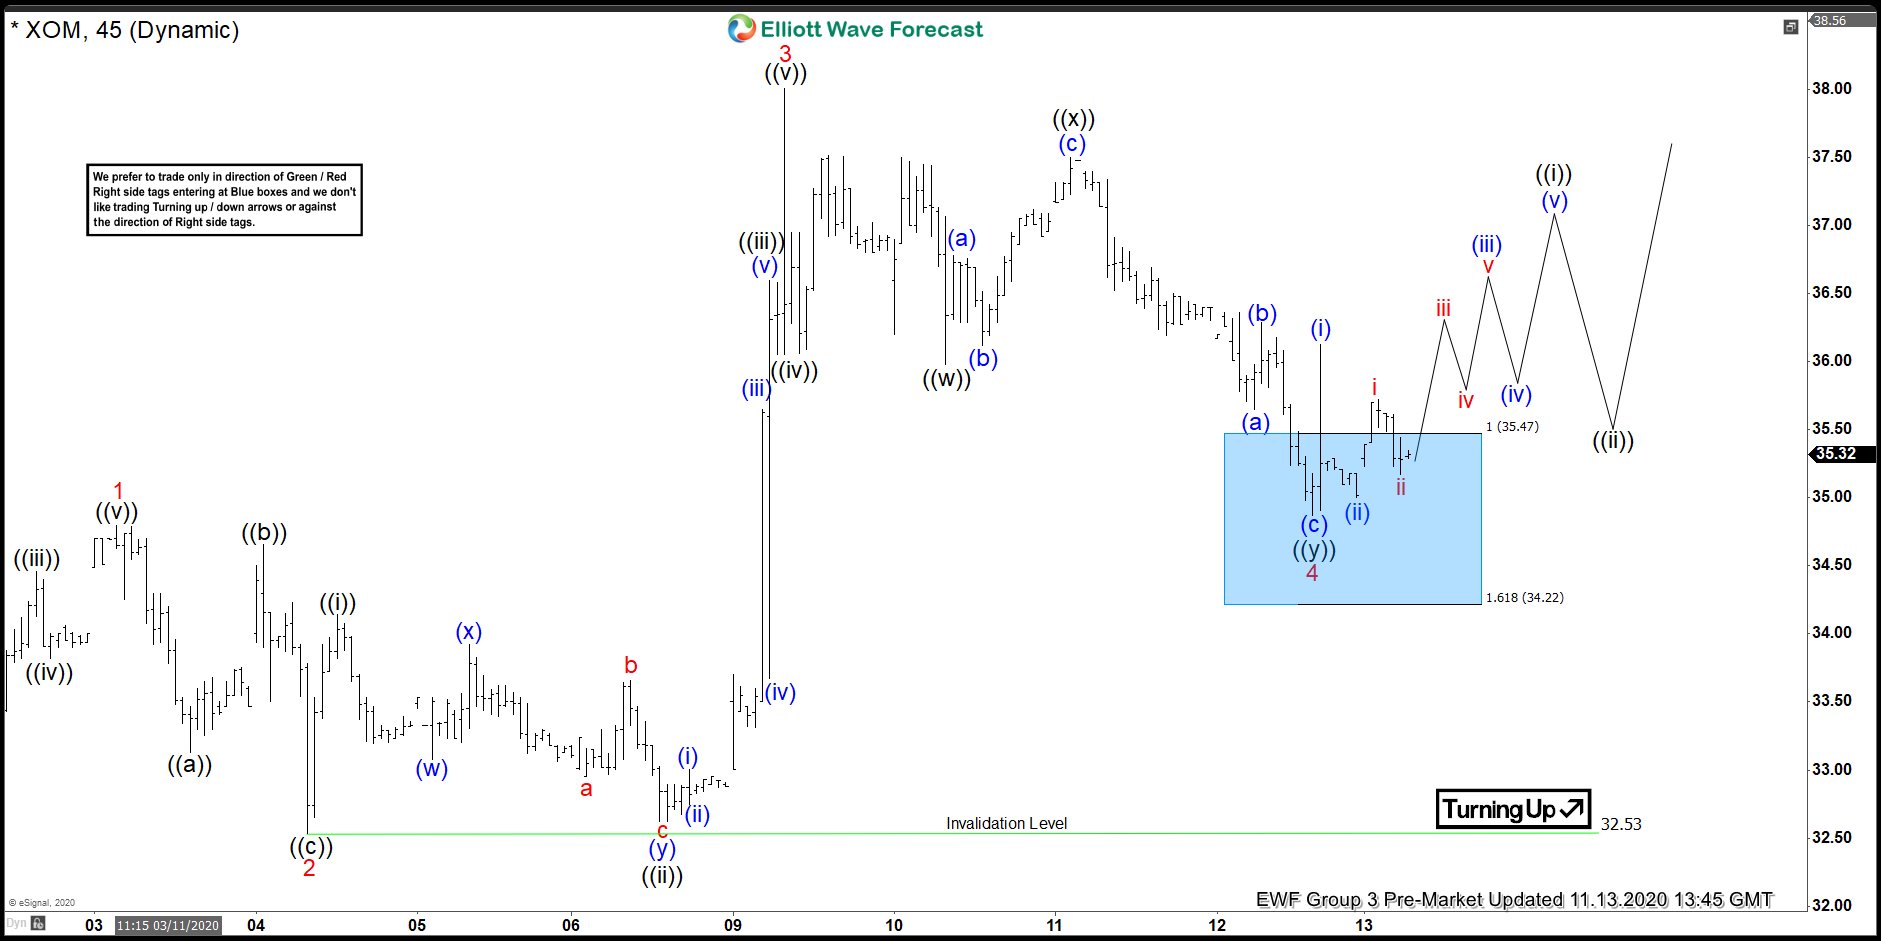
XOM 1 Hour Elliott Wave Analysis 11.13.2020
Eventually we got another leg down toward blue box area. XOM found buyers and giving us nice reaction when we call wave 4 red completed at the 34.86 low. However we would like to see further separation from the current short term low and ideally to see break above red 3 peak( 11/09) in order to confirm wave 5 is in progress. We don’t recommend selling XOM in any proposed pull back and favor the long side from the blue box.
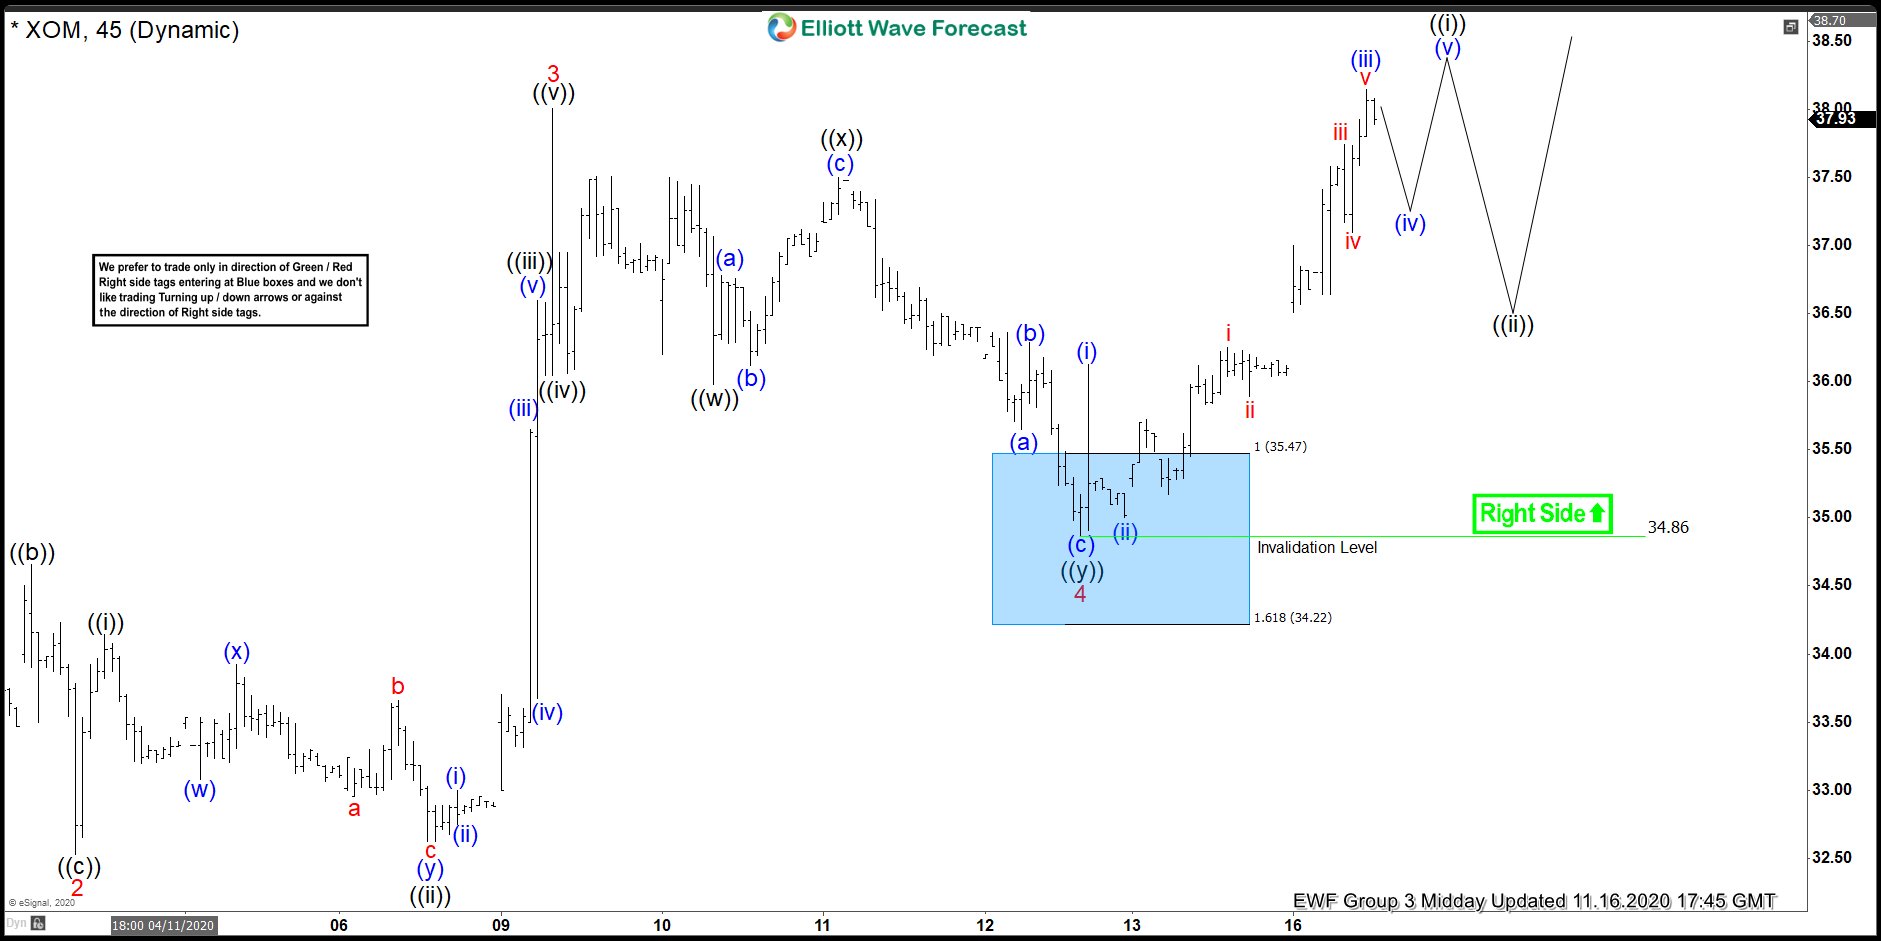
XOM 1 Hour Elliott Wave Analysis 11.13.2020
34.86 low held nicely during the short term pull back and we got further rally. XOM broke 11/09 peak confirming next leg up is in progress. Cycle from the 31.11 low can remain in progress as far as the 34.86 pivot holds. We expect to get pull back that should find buyers again for further rally.
Keep in mind market is dynamic and presented view could have changed in the mean time. You can check most recent charts in the membership area of the site. Best instruments to trade are those having incomplete bullish or bearish swings sequences.We put them in Sequence Report and best among them are shown in the Live Trading Room
Elliott Wave Forecast