In this blog, we would take a look at some Yen crosses to gather the bigger picture and also get an idea of whether they are ready for a bounce or there would be more downside before the bounce occurs. We would also look at long-term Elliott Wave sequences two Yen crosses to explain what is expected after the bounce.
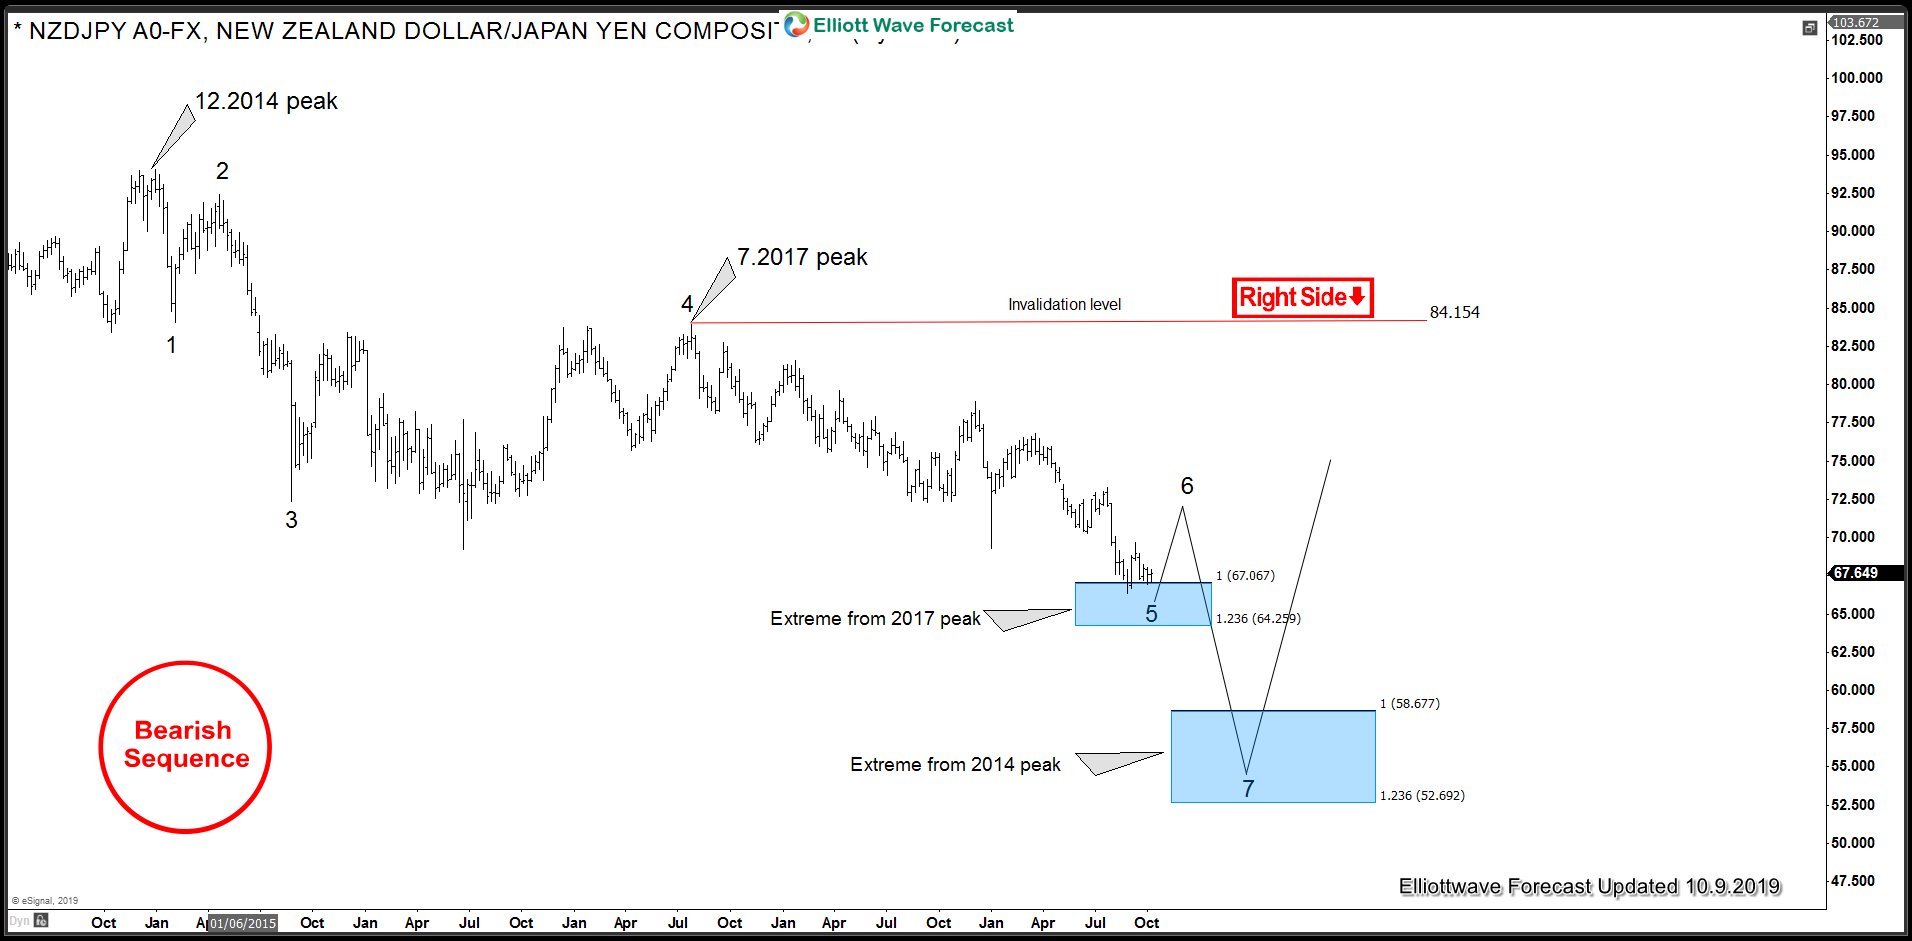
NZDJPY Bearish Sequence from 2014 peak
NZDJPY chart below shows pair is showing 5 swings down from 12.2014 peak which is an incomplete bearish sequence and leaves no doubt about that downside is not over yet. However, we do need to be aware of the fact that pair has reached 1.00 - 1.236 Fibonacci extension area down from 7.2017 peak which means selling at current levels is risky as a bigger bounce should soon take place from the first blue box area on the chart. Next bounce is expected to correct the cycle from 7.2017 peak and then pair should turn lower again toward 58.67 - 52.69 area. Near-term another low can still be seen because even where there is enough number of swings and extension in place to call cycle from 7.2017 peak completed, there is no confirmation yet that the bounce has started. At this stage, our preferred strategy is to wait for a larger bounce in 6th swing to develop before looking for selling opportunities.
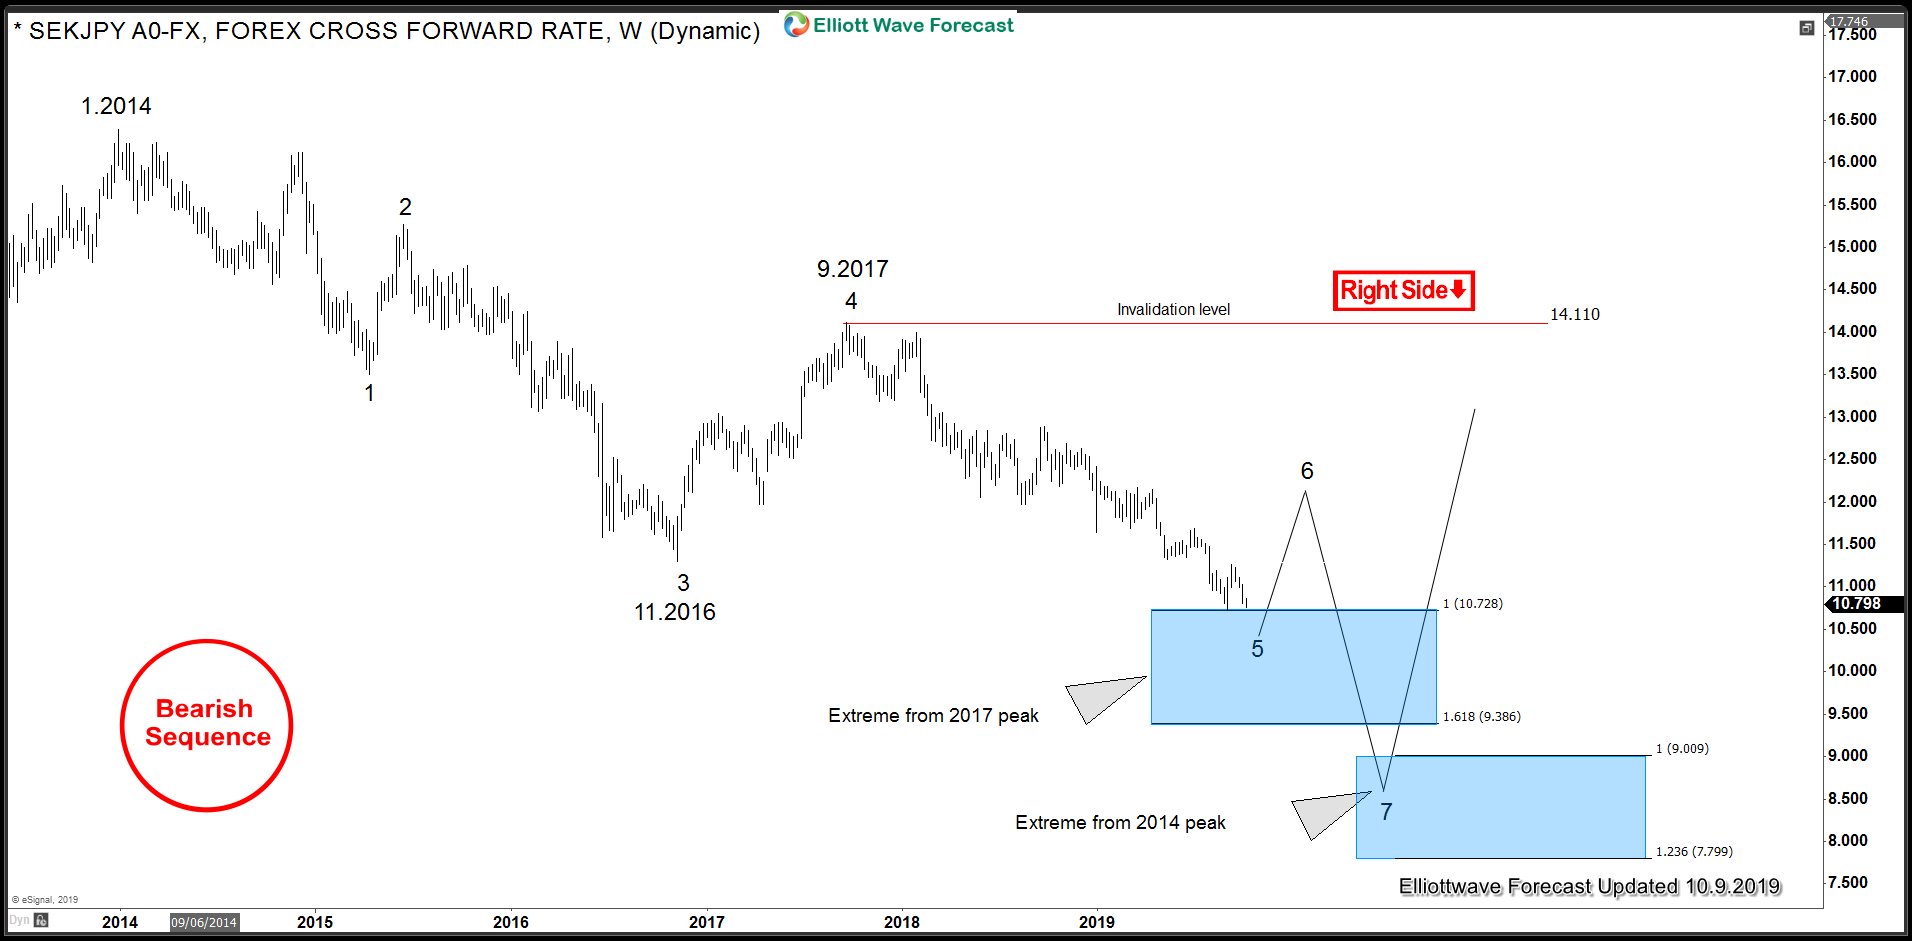
SEKJPY Bearish Elliott Wave Sequence
SEKJPY chart below shows pair is showing 5 swings down from 1.2014 peak which is an incomplete bearish sequence and leaves no doubt about that downside is not over yet. However, we do need to be aware of the fact that pair has reached 1.00 - 1.618 Fibonacci extension area down from 9.2017 peak which means selling at current levels is risky as a bigger bounce should soon take place from the first blue box area on the chart. Next bounce is expected to correct the cycle from 9.2017 peak and then pair should turn lower again toward 9.009- 7.799 area. Near-term another low can still be seen because even where there is enough number of swings and extension in place to call cycle from 7.2017 peak completed, there is no confirmation yet that the bounce has started. At this stage, our preferred strategy is to wait for a larger bounce in 6th swing to develop before looking for selling opportunities.
Now, the question is are we ready for a bounce? There are enough number of swings in place in NZDJPY and SEKJPY to call the cycles completed from 2017 peaks but nothing has confirmed yet that cycle has ended so we would take clues from the short-term incomplete sequence in $CHFJPY that we have shown on the chart below.
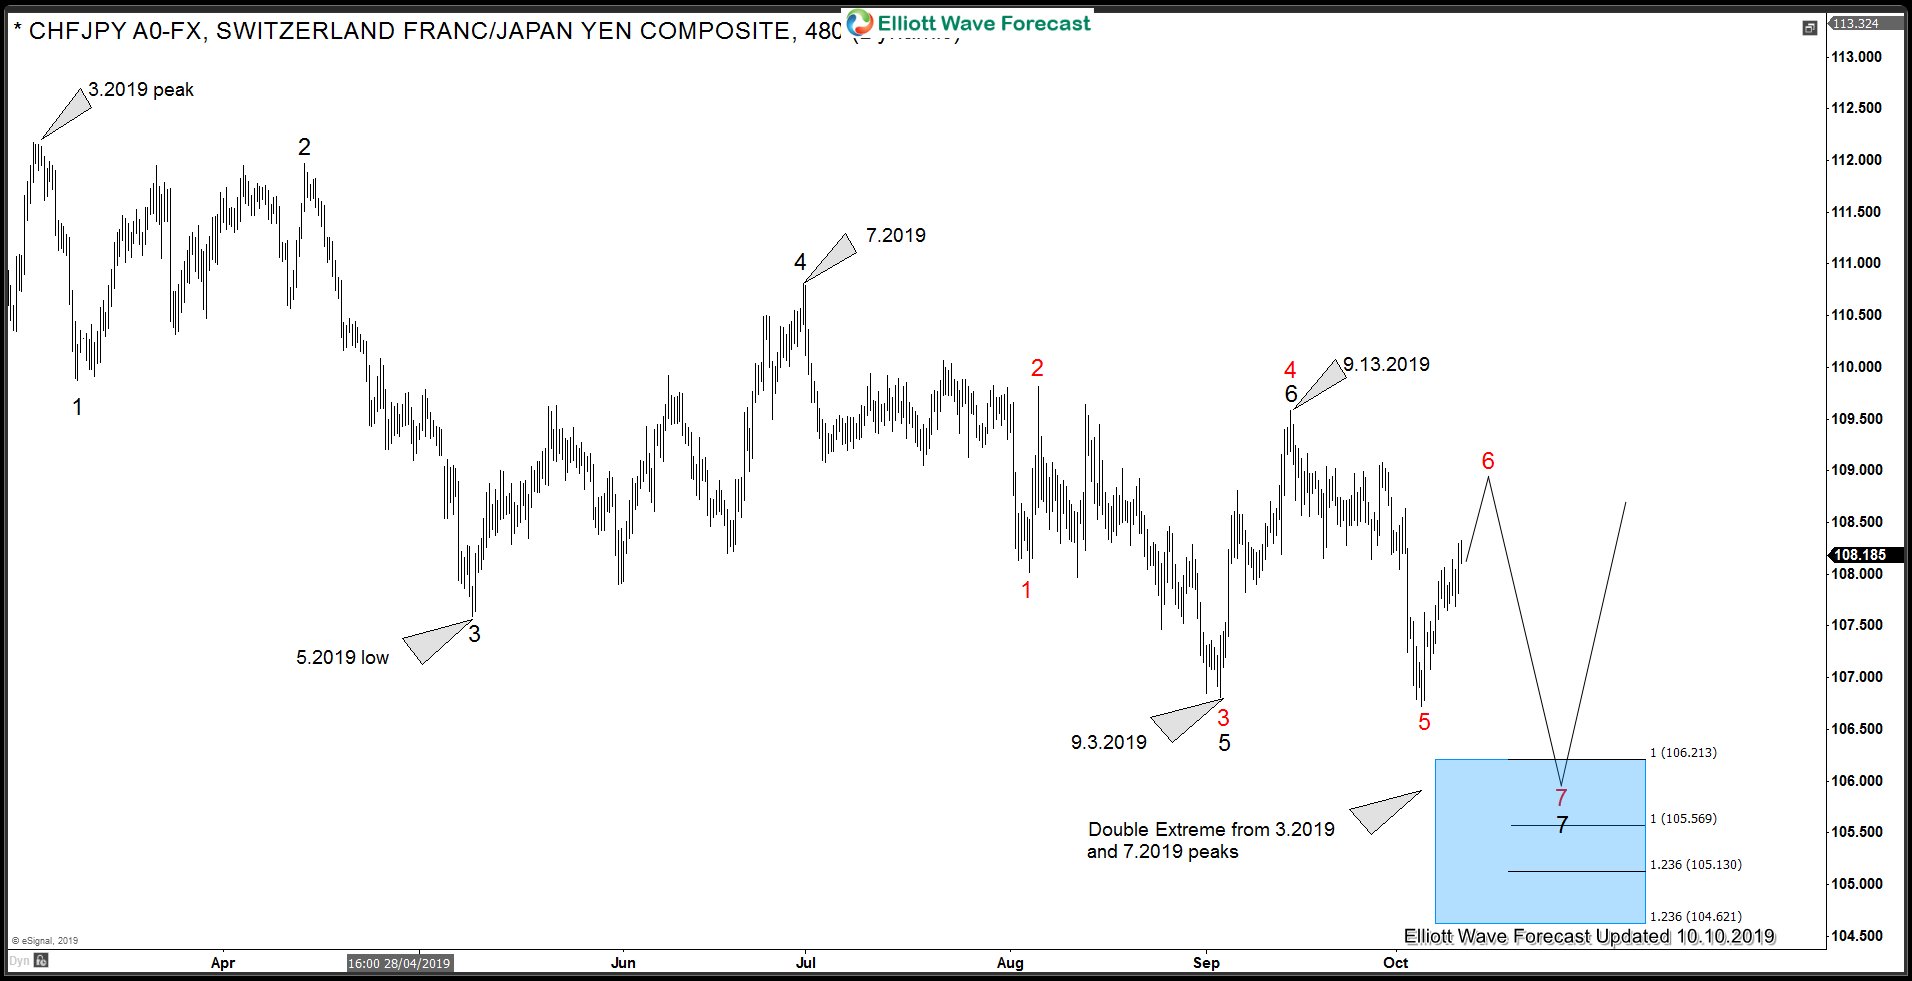
CHFJPY Blue Box can provide the timing for bounce in Yen Crosses
CHFJPY chart below shows that pair is showing 7 swings down from 3.2019 peak but the sequence from 7.2019 peak is still incomplete as we only got 5 swings down from there yet. This means as bounces fail below 9.13.2019 peak, pair should see more downside towards 10.621 - 104.62 area and then start a larger 3 waves bounce at minimum. Based on incomplete sequence from 7.2019 peak in CHFJPY, another low in other Yen crosses could also be seen or they could remain sideways and wait for CHFJPY to reach the blue box before starting the larger bounce. So the blue box in CHFJPY could provide the timing for the bounce to start in the Yen crosses.