Zendesk (NYSE: ZEN) is a customer service software company based in United States. Its cloud-based help desk solution is used by more than 200000 organizations worldwide. the company’s earnings over the next few years are expected to increase by 34%, indicating a highly optimistic future ahead which would attract more investors.
In this article, we’ll be taking a look at the technical picture of the stock using the Elliott wave Theory to identify the potential future path.
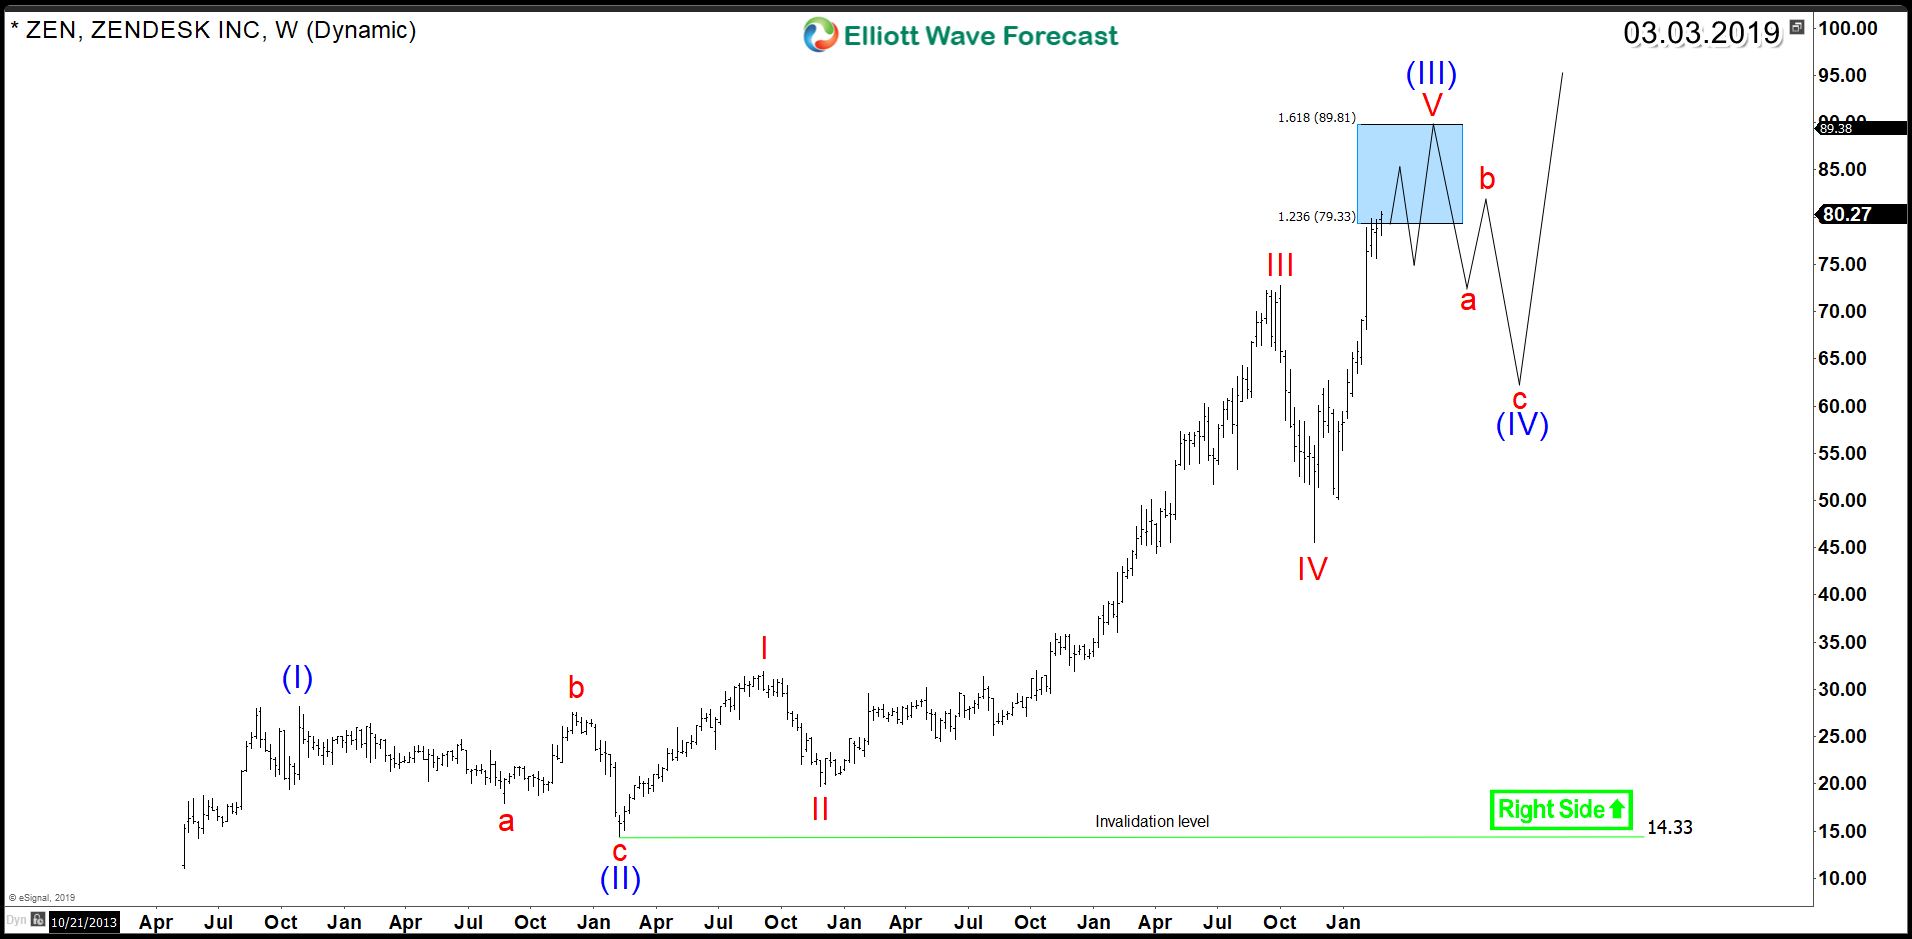
Since IPO, ZEN rallied higher in impulsive waves creating separation from 2014 & 2016 lows. The bullish trend taking place isn’t mature yet as the stock is still trading within the strongest 3rd wave higher. In addition, after a larger correction in wave four, a fifth wave to the upside is expected to take place later on.
ZEN Weekly Elliott Wave Chart

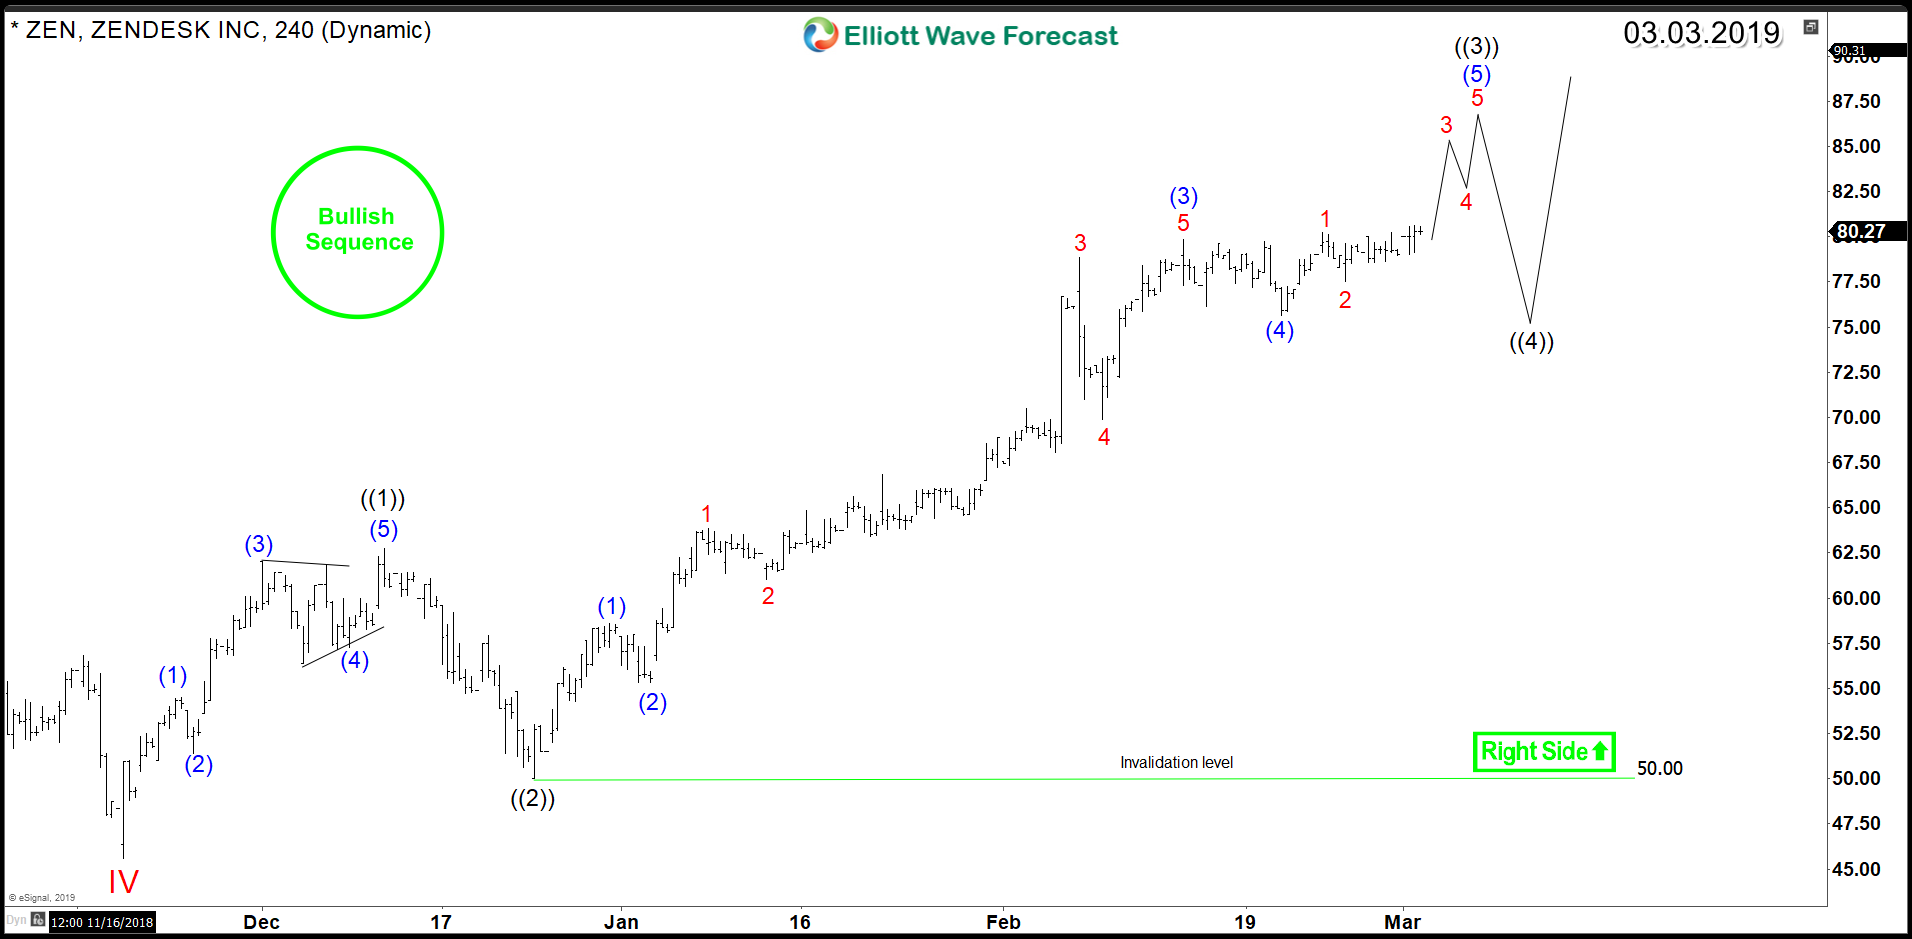
Technically, ZEN reached the minimum target area $79.33 - $89.81 for wave V of (III) presented in the above chart. However, the 4H cycle from December 2018 low is still suggesting further upside to be seen before ending another 5 waves rally. Consequently, short term pullbacks will remain supported and find buyers in 3 , 7 or 11 swings pullback against $50 low.
ZEN 4H Elliott Wave Chart

In conclusion, Zendesk bulls are in total control at this stage as technical picture is supporting a higher price for the stock in both short and long term. So if you are interested in investing or trading ZEN then you should keep an eye on the next pullback which can provide you with a good entry to join the rally.