Soybean Oil is one of the grain & oilseed commodities, along with wheat, soybeans, corn, rice, oats and others. Just behind palm oil, it is the second most used vegetable oil, basically, for frying and baking. Also, soybean oil finds applications medically and, when processed, for printing inks and oil paints. One can trade Soybean Oil futures at Chicago Board of Trade in contracts of 60’000 pounds each under the ticker ZL #F.
In the initial article from November 2020, we have forecasted an new cycle higher from an important bottom in April 2020. We were right. Indeed, the prices have extended to the new all-time highs by printing a top at 73.74. Then, in December 2021, we were expecting more upside within bullish sequence towards 95.99-112.82 area. Again, we were right. Another bullish cycle has brought the prices towards 90.69 highs in April 2022. Now, Soybeans a pulling back and provide an opportunity to join the rally. Here, we discuss the wave structure of ZL #F, incomplete bullish sequence, buying setup and the targets. .
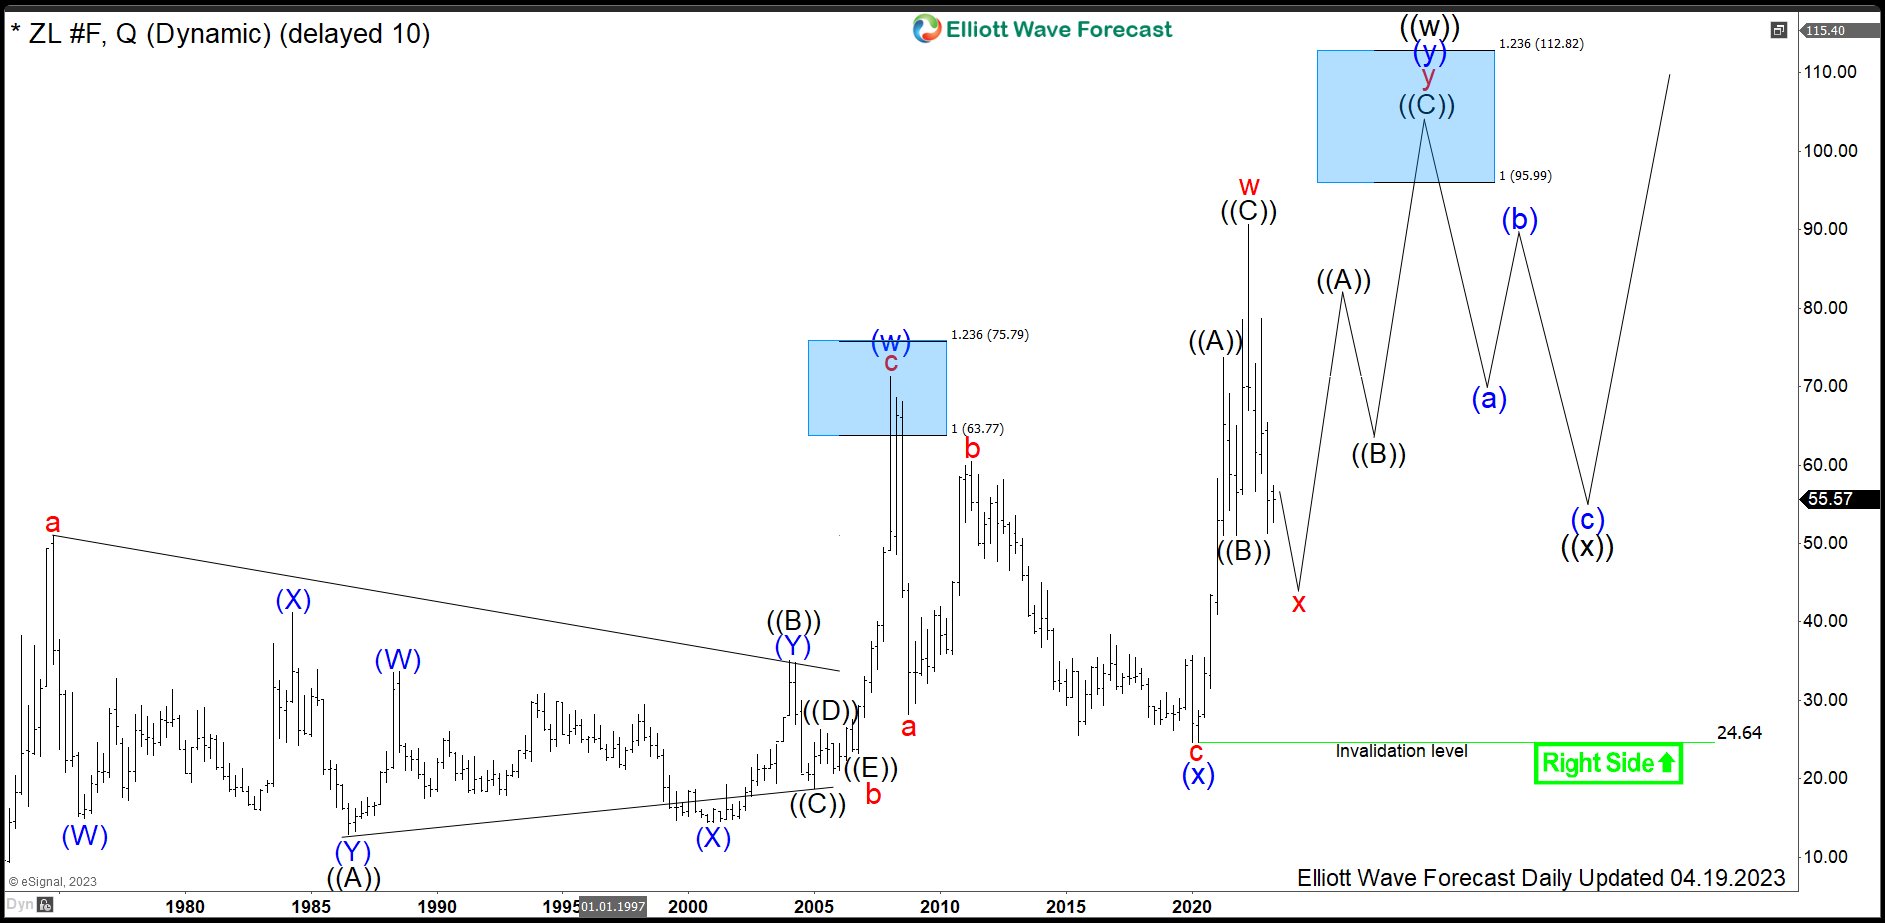
Soybean Oil Quarterly Elliott Wave Analysis 04.19.2023
The quarterly chart below shows the soybean oil front contract ZL #F. From the all-time lows, the prices have developed a cycle higher in blue wave (w) of a super cycle degree. It has ended in March 2008 at 71.23. From the highs, a correction lower in wave (x) has unfolded as an Elliott Wave zigzag pattern. In 12 years, ZL #F has become cheaper by more than 60% reaching 24.64 level. It is the preferred view that an important bottom on April 2020 has been set and the blue wave (x) has ended. From the lows, a ney cycle up in wave (y) has been confirmed by breaking above 71.23 highs. In shorter cycles, red wave w of wave (y) has ended. Now, pullback in wave x is taking place. Based on the bullish sequence, current dip should find support in 3, 7, 11 swings for another extension higher in red wave y of blue wave (y). Therefore, investors and traders can be looking to buy it in 3 swings off the top. Target is 95.99-112.82 area.
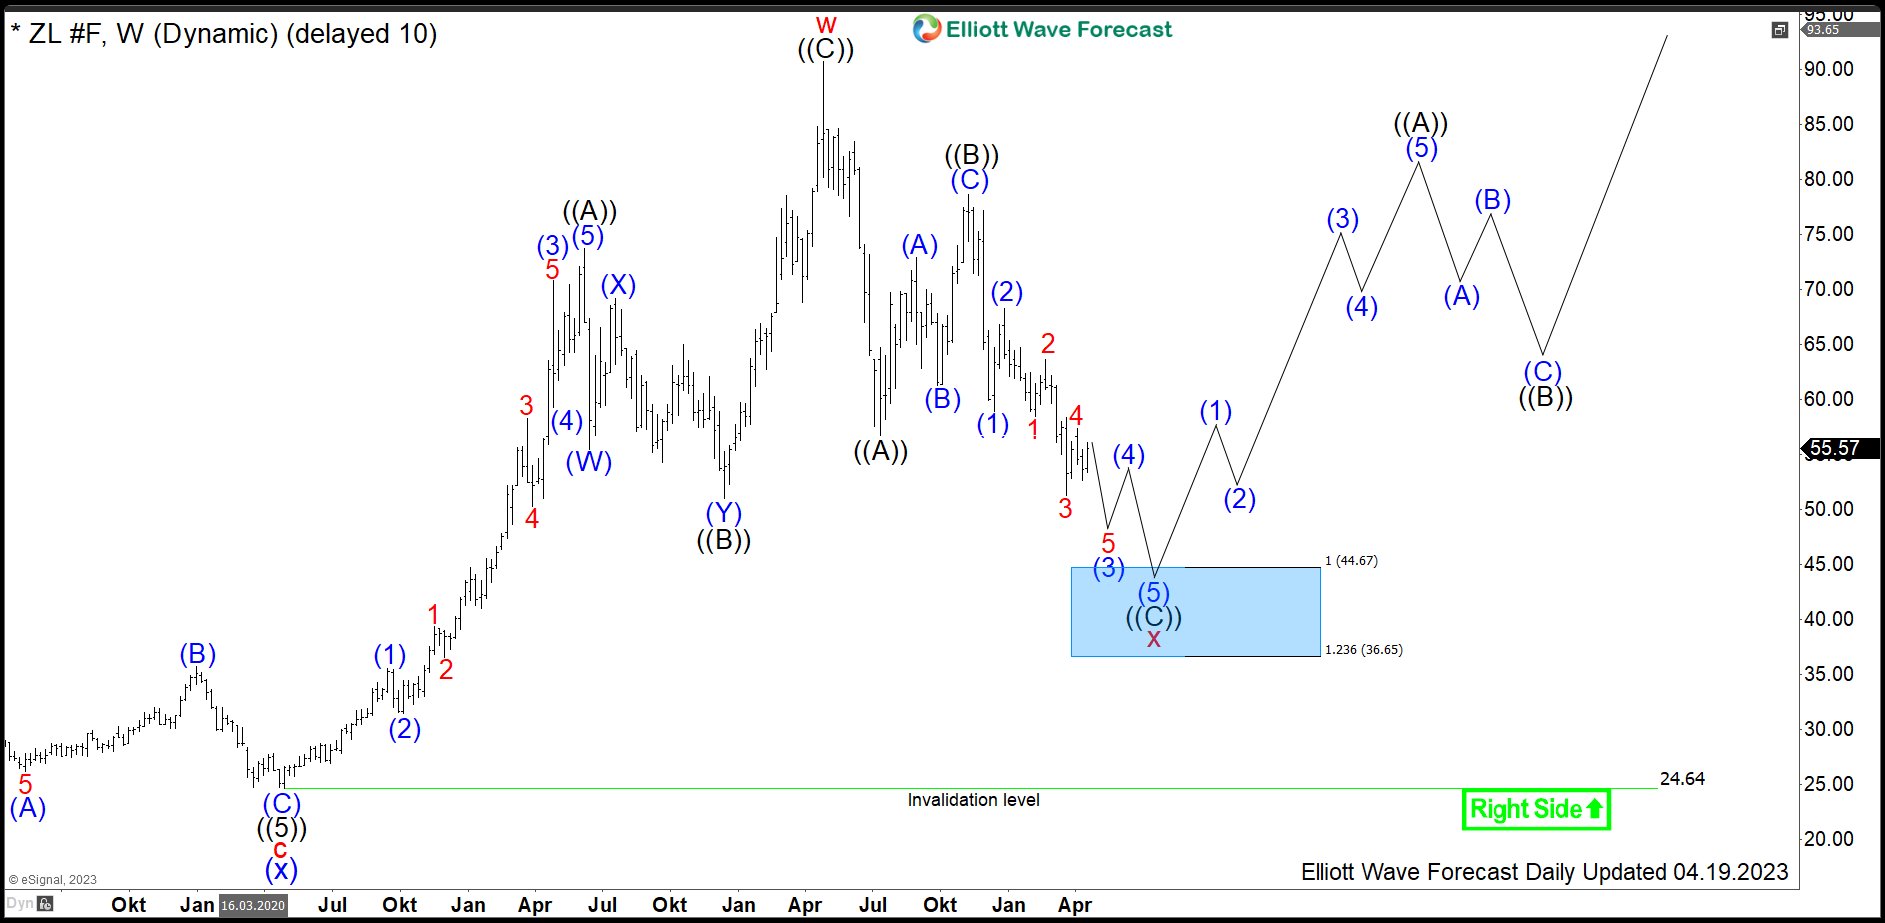
Soybean Oil Weekly Elliott Wave Analysis 04.19.2023
The weekly chart below shows in more detail the advance from the April 2020 lows in 3 swings of red wave w and the ongoing pullback in red wave x. From the bottom at 24.64, red wave w higher has unfolded as a zigzag structure. Hereby, 3rd swing in black wave ((C)) has not reached 100% extension and shows truncation. From the 90.69 highs in April 2022, a pullback lower in red wave x unfolds as another zigzag structure. Firstly, black wave ((A)) has ended in July 2022 at 56.68 lows. Then, a connector in black wave ((B)) has printed a lower high in November 2022 at 78.64. From there, black wave ((C)) has broken 56.68 lows opening up a bearish sequence. Now, expect ZL #F to reach into the 44.67-24.64 buying area. There, investors and traders should be waiting to go long. As next, blue box area should provoke a reaction higher in black wave ((A)) of red wave y.