Soybean Oil is one of the grain & oilseed commodities, along with wheat, soybeans, corn, rice, oats and others. Just behind palm oil, it is the second most used vegetable oil, basically, for frying and baking. Also, soybean oil finds applications medically and, when processed, for printing inks and oil paints. One can trade Soybean Oil futures at Chicago Board of Trade in contracts of 60’000 pounds each under the ticker ZL #F.
In the initial article last year, we have forecasted an new cycle higher. We were right. Indeed, the prices have extended to the new all-time highs by printing a top at 73.74. Currently, we see commodities pulling back along with short-term dollar dynamic. Soon, we expect the dollar to turn lower. Hence, commodities may start a new cycle to the upside. In particular, wave structure of ZL #F supports a new bullish cycle. Here, we present the updated view.
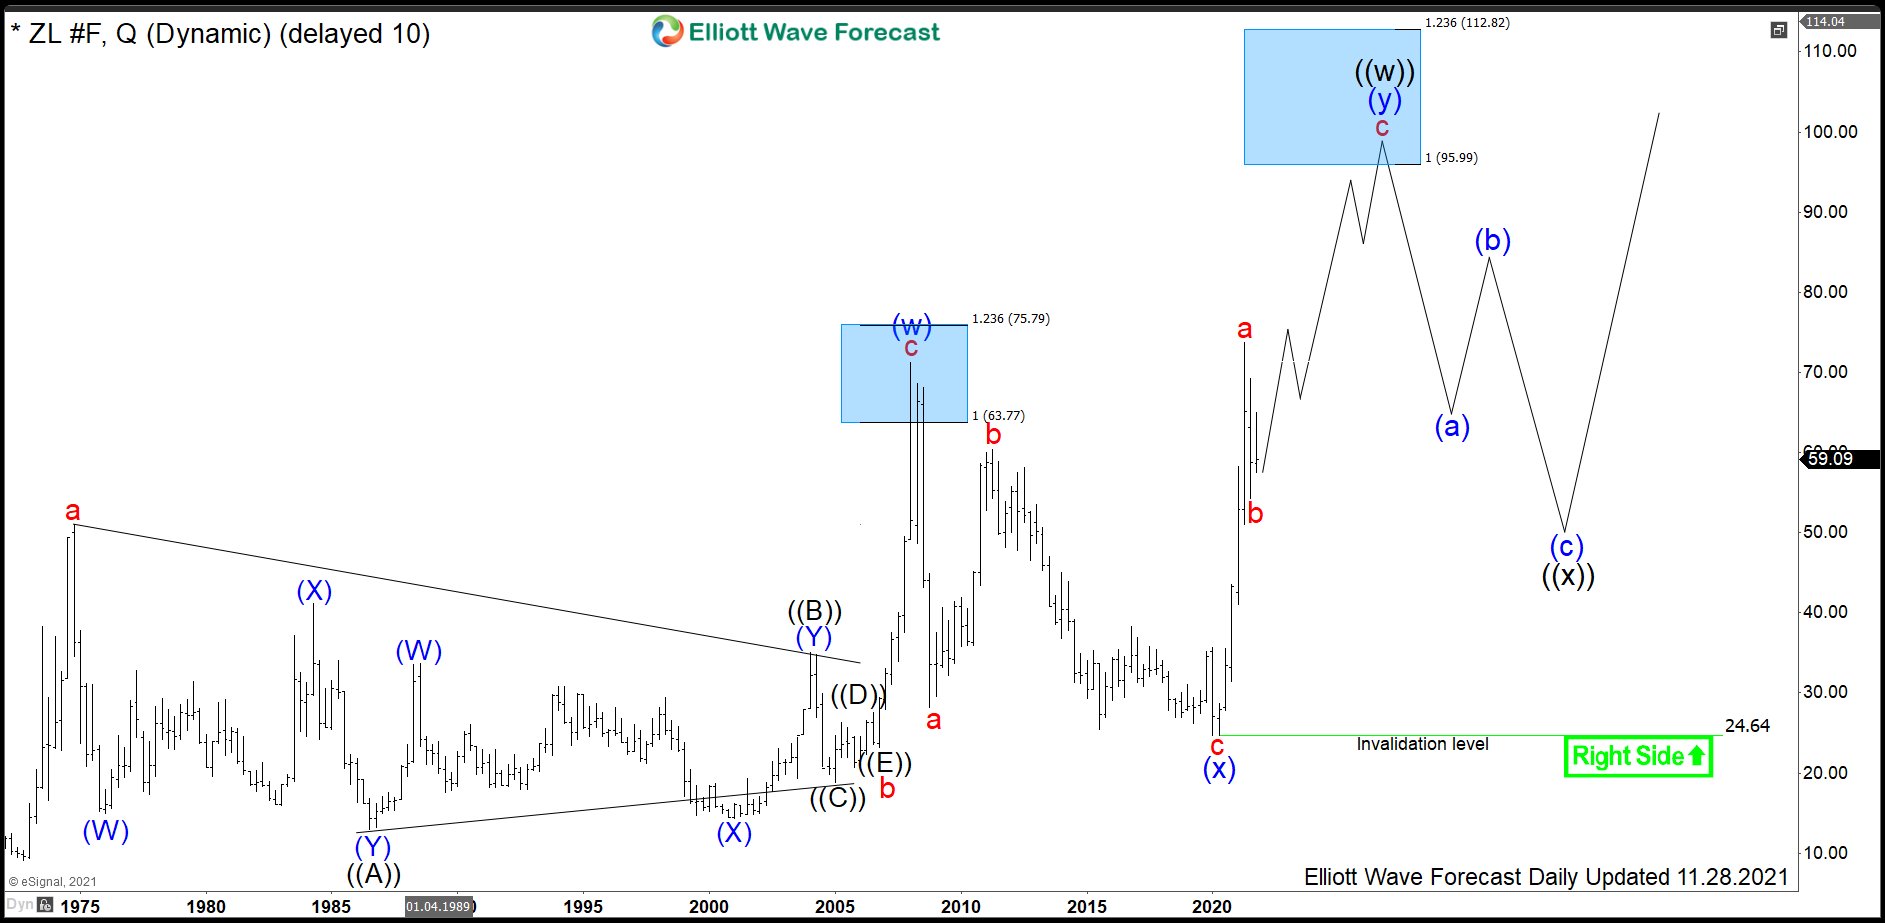
Soybean Oil Quarterly Elliott Wave Analysis 12.05.2021
The quarterly chart below shows the soybean oil front contract ZL #F. From the all-time lows, the prices have developed a cycle higher in blue wave (w) of a super cycle degree. It has ended in March 2008 at 71.23. From the highs, a correction lower in wave (x) has unfolded as an Elliott Wave zigzag pattern. In 12 years, ZL #F has become cheaper by more than 60% reaching 24.64 level. It is the preferred view that an important bottom on April 2020 has been set and the blue wave (x) has ended. From the lows, a ney cycle up in wave (y) has been confirmed by breaking above 71.23 highs. In shorter cycles, waves a-b of wave (y) have ended. Based on the bullish sequence which has been opened, wave c of (y) can extend towards 95.99-112.82 area and possibly higher.
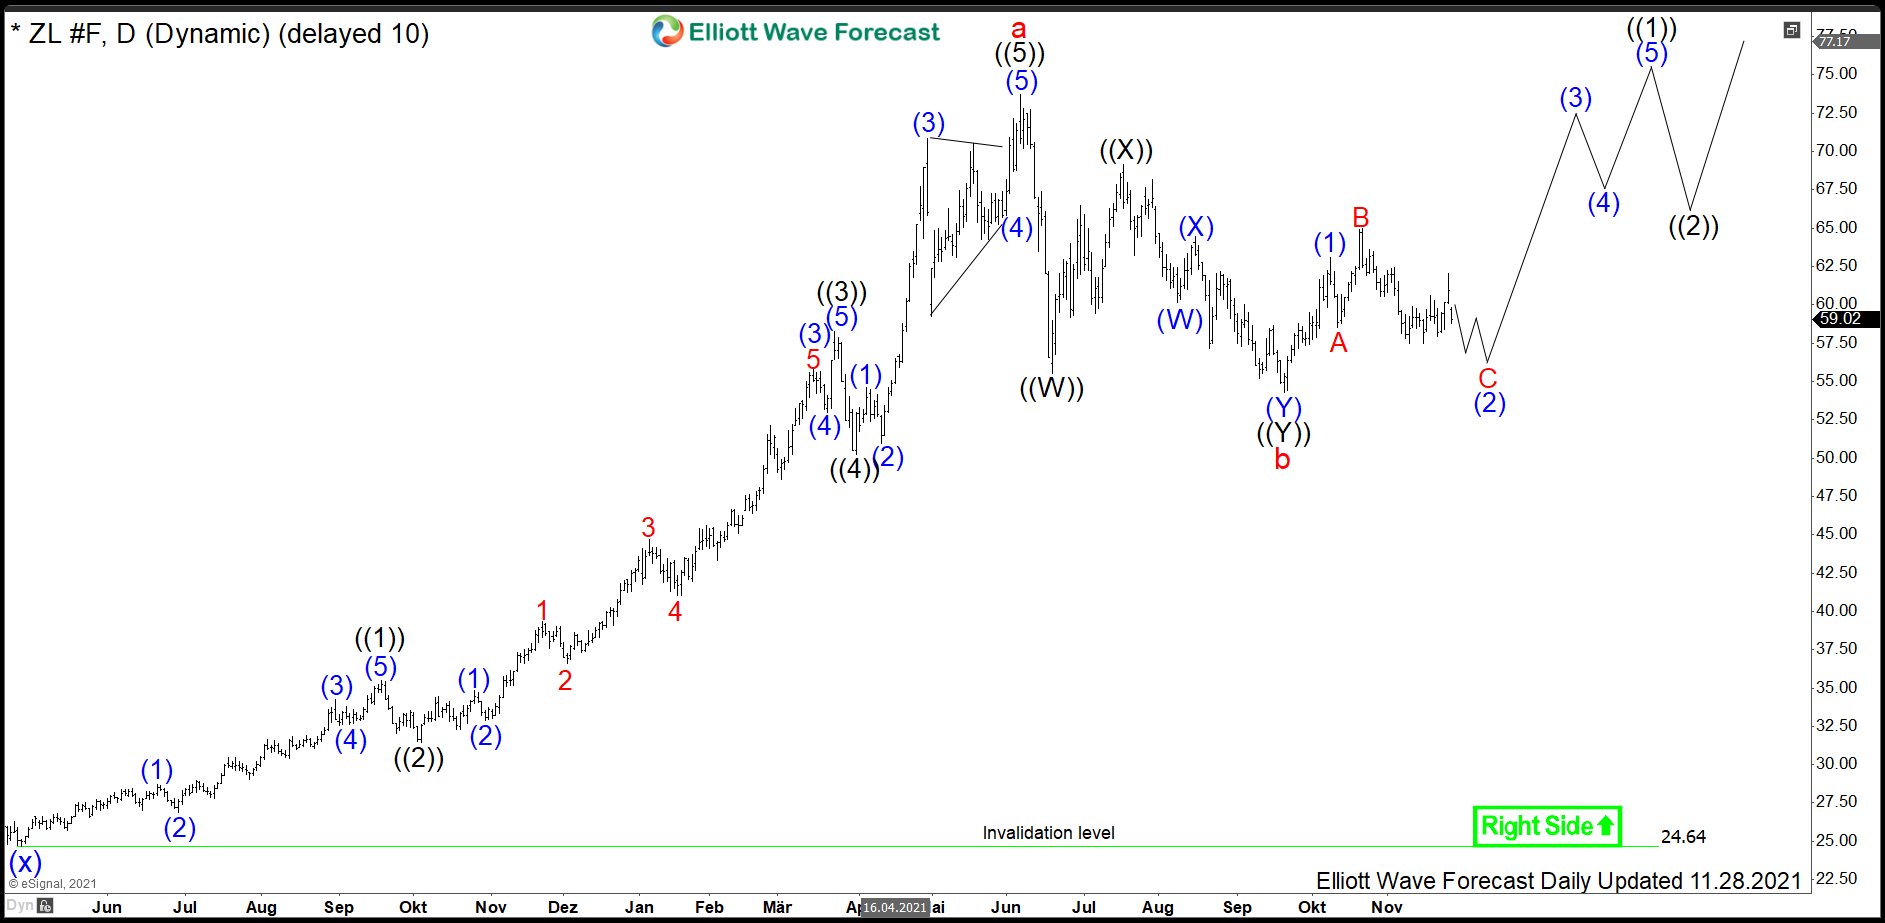
Soybean Oil Daily Elliott Wave Analysis 12.05.2021
The daily chart below shows in more detail the advance from the April 2020 lows. From the bottom at 24.64, red wave a higher has unfolded as an impulse. It has printed the all-time high at 73.74. From the highs, a pullback in wave b has ended in September 2021 at 54.27. While above there, wave c of (y) might be in the first stages.
Investors and traders can be, therefore, looking to buy pullbacks in 3, 7 or 11 swings against 24.64 lows. In a long run, soybean oil should reach 95.99-112.82 area and possibly higher.
Source: https://elliottwave-forecast.com/commodities/soybean-oil-ready-new-cycle/