Oats are one of the grain commodities, along with soft red wheat, hard red wheat, corn, soybeans and others. The oat (Avena sativa) is a species of cereal grain grown for its seed. While oats are suitable for human consumption as oatmeal and rolled oats, one of the most common uses is as livestock feed. Oats are a nutrient-rich food associated with lower blood cholesterol when consumed regularly. Since this cereal grain plays a role in the food supply chains for both humans and livestock, investors should be paying attention to the price development of the oats as a commodity. One can trade oats futures at Chicago Board of Trade under the ticker $ZO. Hereby, the contract size is 5’000 bushels (300’000 pounds) each and the prices are in Dollars US per 100 bushel.
Oats Quarterly Elliott Wave Analysis 09.09.2022
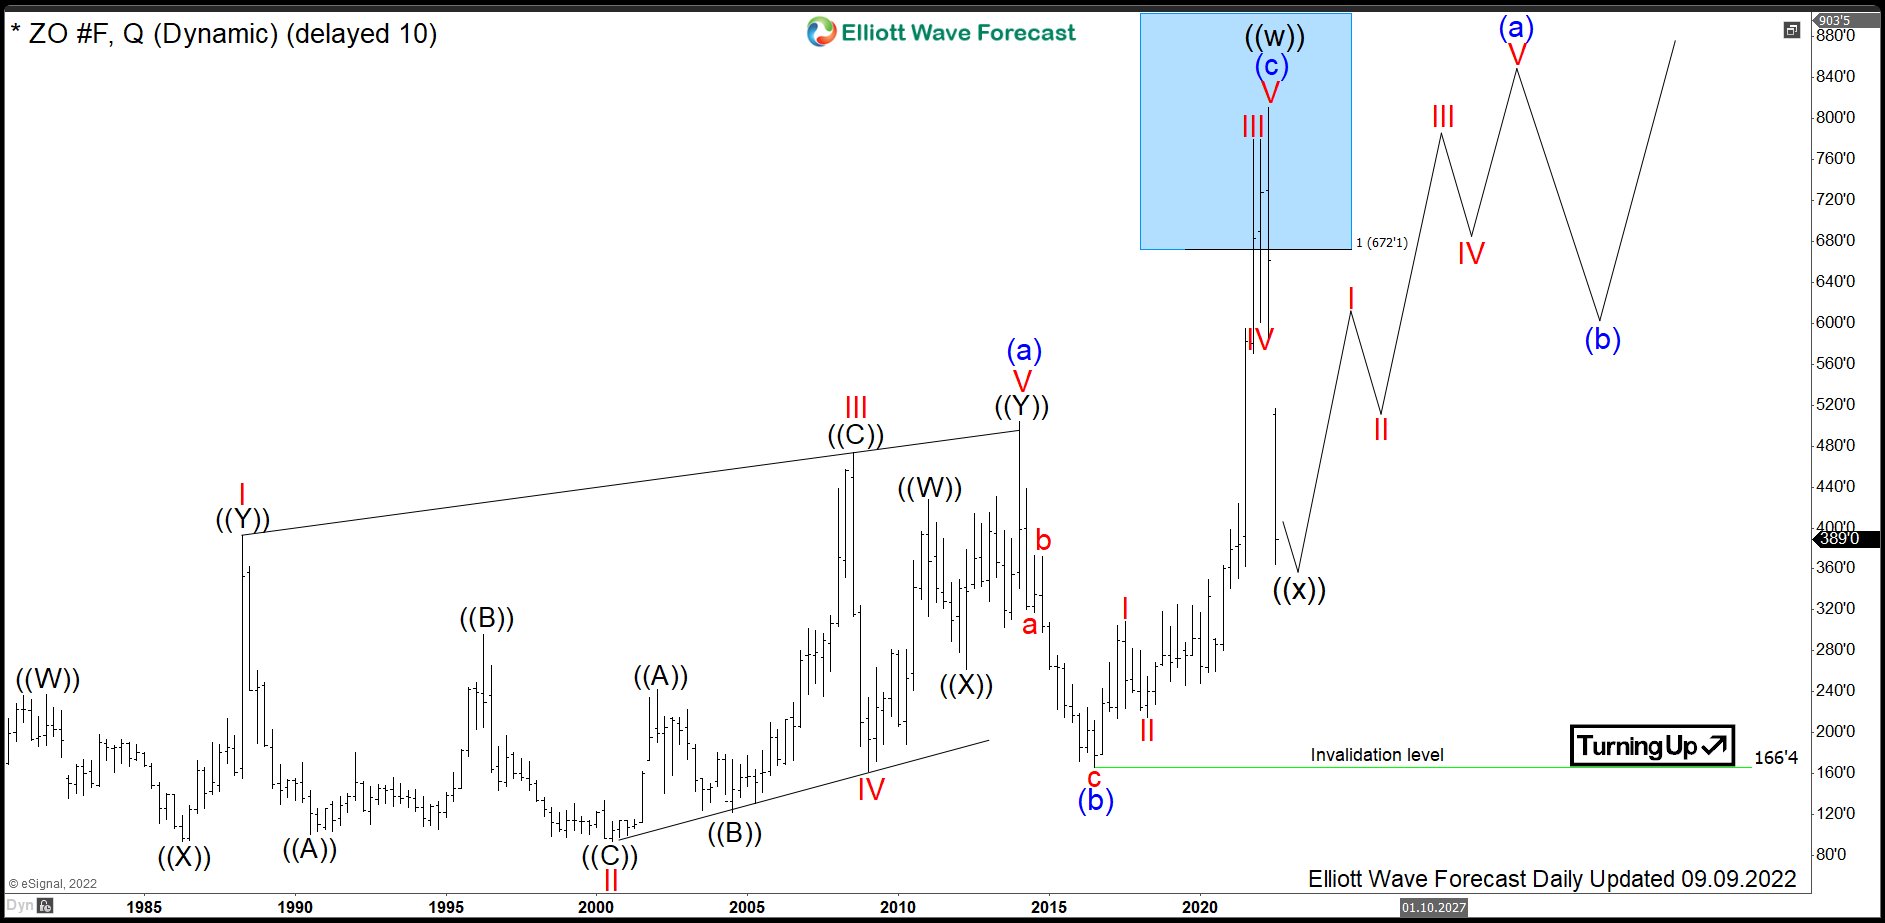
The weekly chart below shows the Oats front contract ZO #F. From the all-time lows, the prices have developed a cycle higher in black wave ((w)) of a grand super cycle degree. It has ended in April 2022 by printing the new all-time high at 811 Dollars. The overall structure from 1974 to 2022 has unfolded as an Elliott wave zigzag pattern. Firstly, a leading diagonal in blue wave (a) has ended in January 2014 at 504’4. Then, from the highs, a correction in blue wave (b) has printed an important bottom at 166’4. From the lows, a new cycle in wave (c) shows an impulse. It has reached the 672’1-984’6 area.
From the April 2022 highs, a correction lower in wave ((x)) against the all-time lows is currently in progress and should find support in 3, 7, 11 swings. 2023-2030, the expectations are to break out to the new all-time highs.
Oats Weekly Elliott Wave Analysis 09.09.2022
The daily chart below shows in more detail the advance from the April 2018 lows and the correction of the cycle against the all-time lows. From the April 2018 low at 215, one can clearly see an impulsive blue wave (c) up. Obviously, there is an extension within blue wave (3) of black wave ((3)) of red wave III. As a matter of fact, such an extension is a characteristic feature of an impulse. After printing the new all-time high at 811 Dollars, a consolidation lower in black wave ((x)) is unfolding as a Zigzag being a 5-3-5 structure. Firstly, blue wave (a) has ended in May 2022 at 585’6 lows. Then, a bounce in wave (b) has set a connector at 708’2. From there, a new cycle in wave (c) has been confirmed by breaking the May lows.
Investors and traders can be looking to buy the weekly blue box being 483’4-344’3 area. There, a reaction higher in black wave ((y)) should take place. Long-term target is $811 and beyond. Alternatively, a reaction in 3 waves as minimum out of the blue box range should take place.
