Oats are one of the grain commodities, along with soft red wheat, hard red wheat, corn, soybeans and others. The oat (Avena sativa) is a species of cereal grain grown for its seed. While oats are suitable for human consumption as oatmeal and rolled oats, one of the most common uses is as livestock feed. Oats are a nutrient-rich food associated with lower blood cholesterol when consumed regularly. Since this cereal grain plays a role in the food supply chains for both humans and livestock, investors should be paying attention to the price development of the oats as a commodity. One can trade oats futures at Chicago Board of Trade under the ticker $ZO. Hereby, the contract size is 5’000 bushels (300’000 pounds) each and the prices are in Dollars US per 100 bushel.
From September 2022, we have explained that $ZO are correcting against the all-time lows. Today, we see correction ended back in April 2023 at $300 and next bullish cycle might have started. In the current blog, we provide an update discussing next price targets.
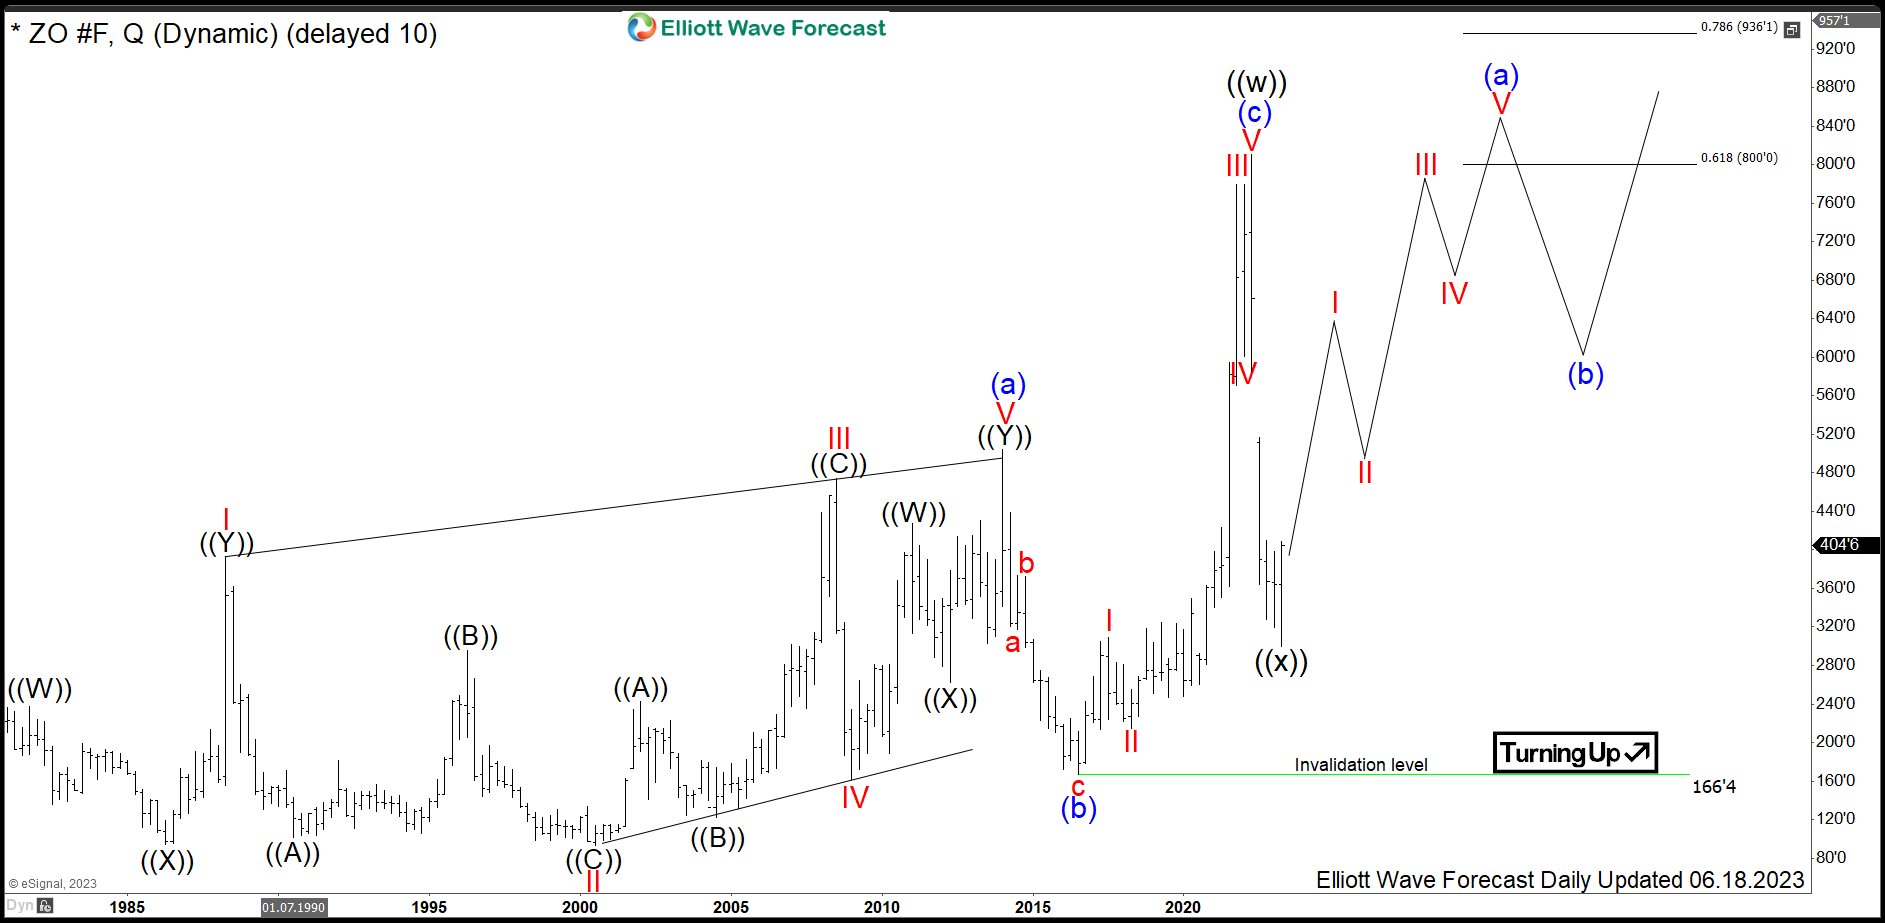
Oats Quarterly Elliott Wave Analysis 06.18.2023
The quarterly chart below shows the Oats front contract ZO #F. From the all-time lows, the prices have developed a cycle higher in black wave ((w)) of a grand super cycle degree. It has ended in April 2022 by printing the all-time highs at $811. The overall structure from 1974 to 2022 has unfolded as an Elliott wave zigzag pattern. Firstly, a leading diagonal in blue wave (a) has ended in January 2014 at 504’4. Then, from the highs, a correction in blue wave (b) has set a bottom at 166’4. From the lows, a new cycle in wave (c) shows an impulse. It has ended in April 2022 at 811 Dollars.
From April 2022 highs, a correction lower in wave ((x)) against the all-time lows shows another zigzag pattern. It is the preferred view that it has ended at April 2023 lows $300. While above there, next bullish cycle in black wave ((y)) might have started. It may now develop 3 swings higher targeting 1110-1611 area. In the medium term, wave (a) might reach 0.618-0.786 intermediary range corresponding to $800-$936 area. That alone will double the prices of oats boosting the ongoing inflation in food prices.
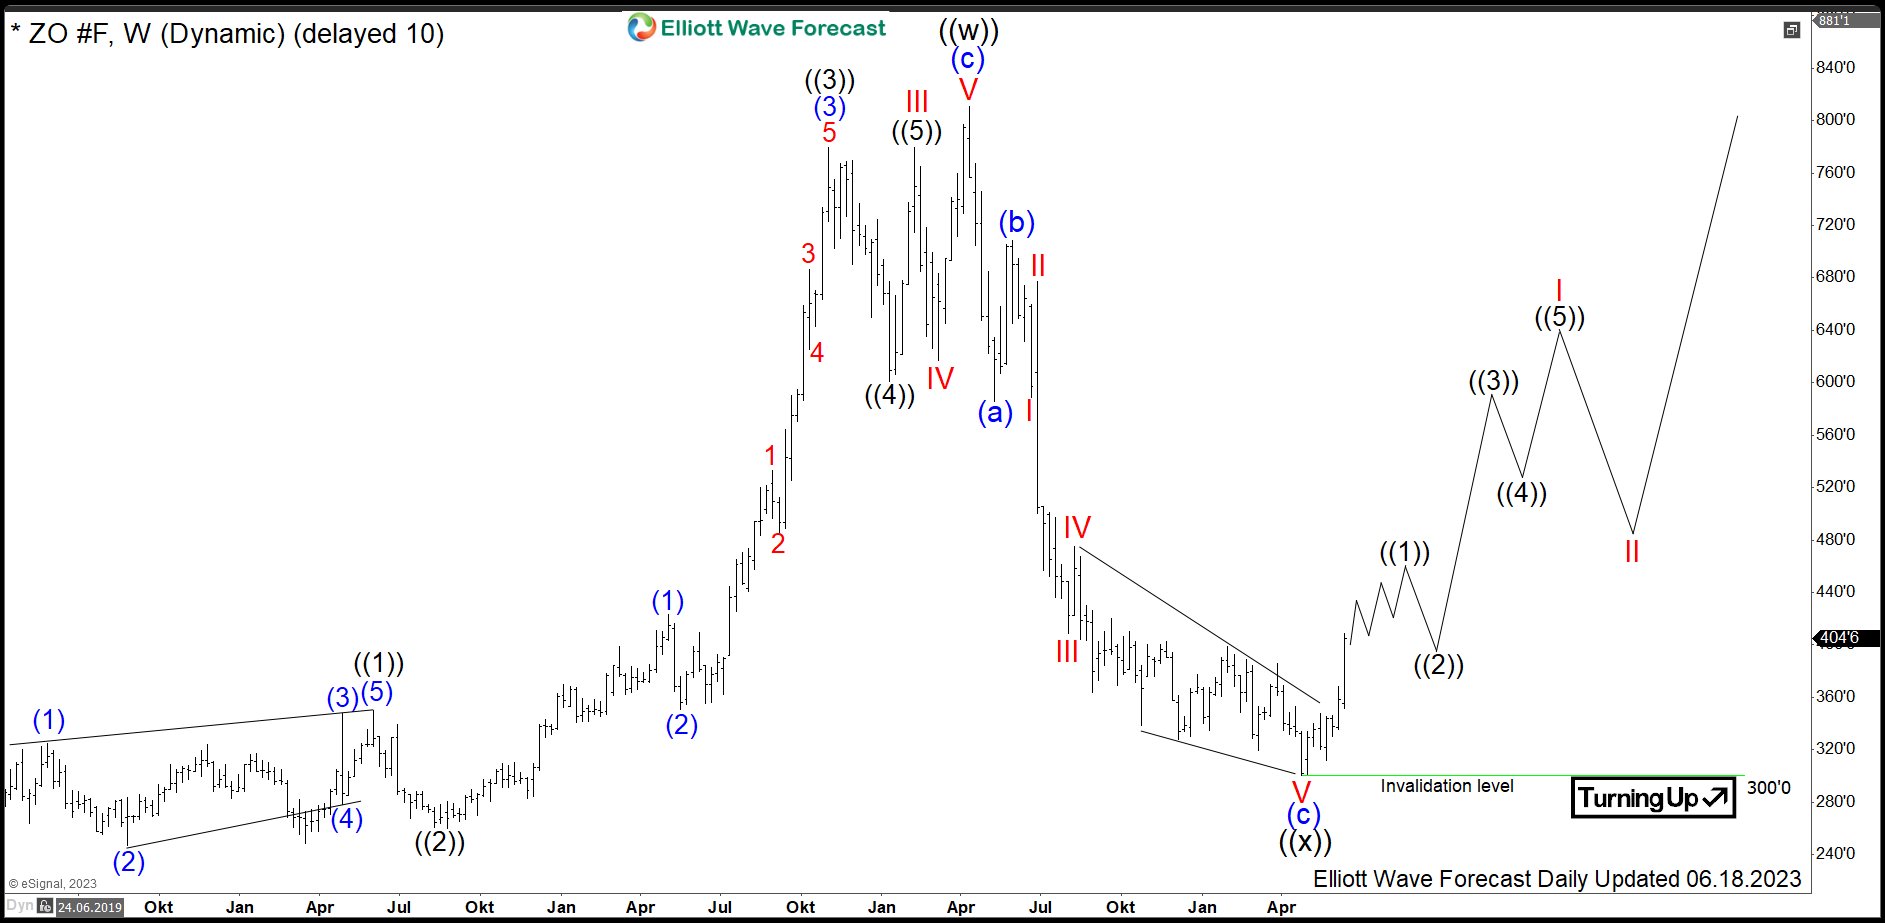
Oats Weekly Elliott Wave Analysis 06.18.2023
The weekly chart below shows in more detail the advance from the 2019 lows, the consolidation against the all-time lows and the initial stages of blue wave (a) of black wave ((y)). From 2019 lows, one can clearly see an impulsive blue wave (c). Obviously, there is an extension within blue wave (3) of black wave ((3)) of red wave III. As a matter of fact, such an extension is a characteristic feature of an impulse. After printing the new all-time high at 811 Dollars, a consolidation lower in black wave ((x)) has unfolded as a Zigzag being a 5-3-5 structure.
Firstly, blue wave (a) has ended in May 2022 at 585’6 lows. Then, a bounce in wave (b) has set a connector at 708’2. From there, a new cycle in wave (c) has been confirmed by breaking the May 2022 lows. It has surpassed the previously mentionned 483’4-344’3 area. Now, it is the preferred view that the correction in wave ((x)) has ended in April 2023 at $300 lows. Indeed, the bounce off the lows has broken the descending RSI channel. Also, we see other commodities like Soybeans/Wheat turning higher.
While short term traders should wait for wave ((1)) to end first and then buy dips of wave ((2)) in 3, 7 swings against $300 lows, investors can enter the market at current prices targeting 800-936 area in medium-term and 1110-1611 area in the long run.