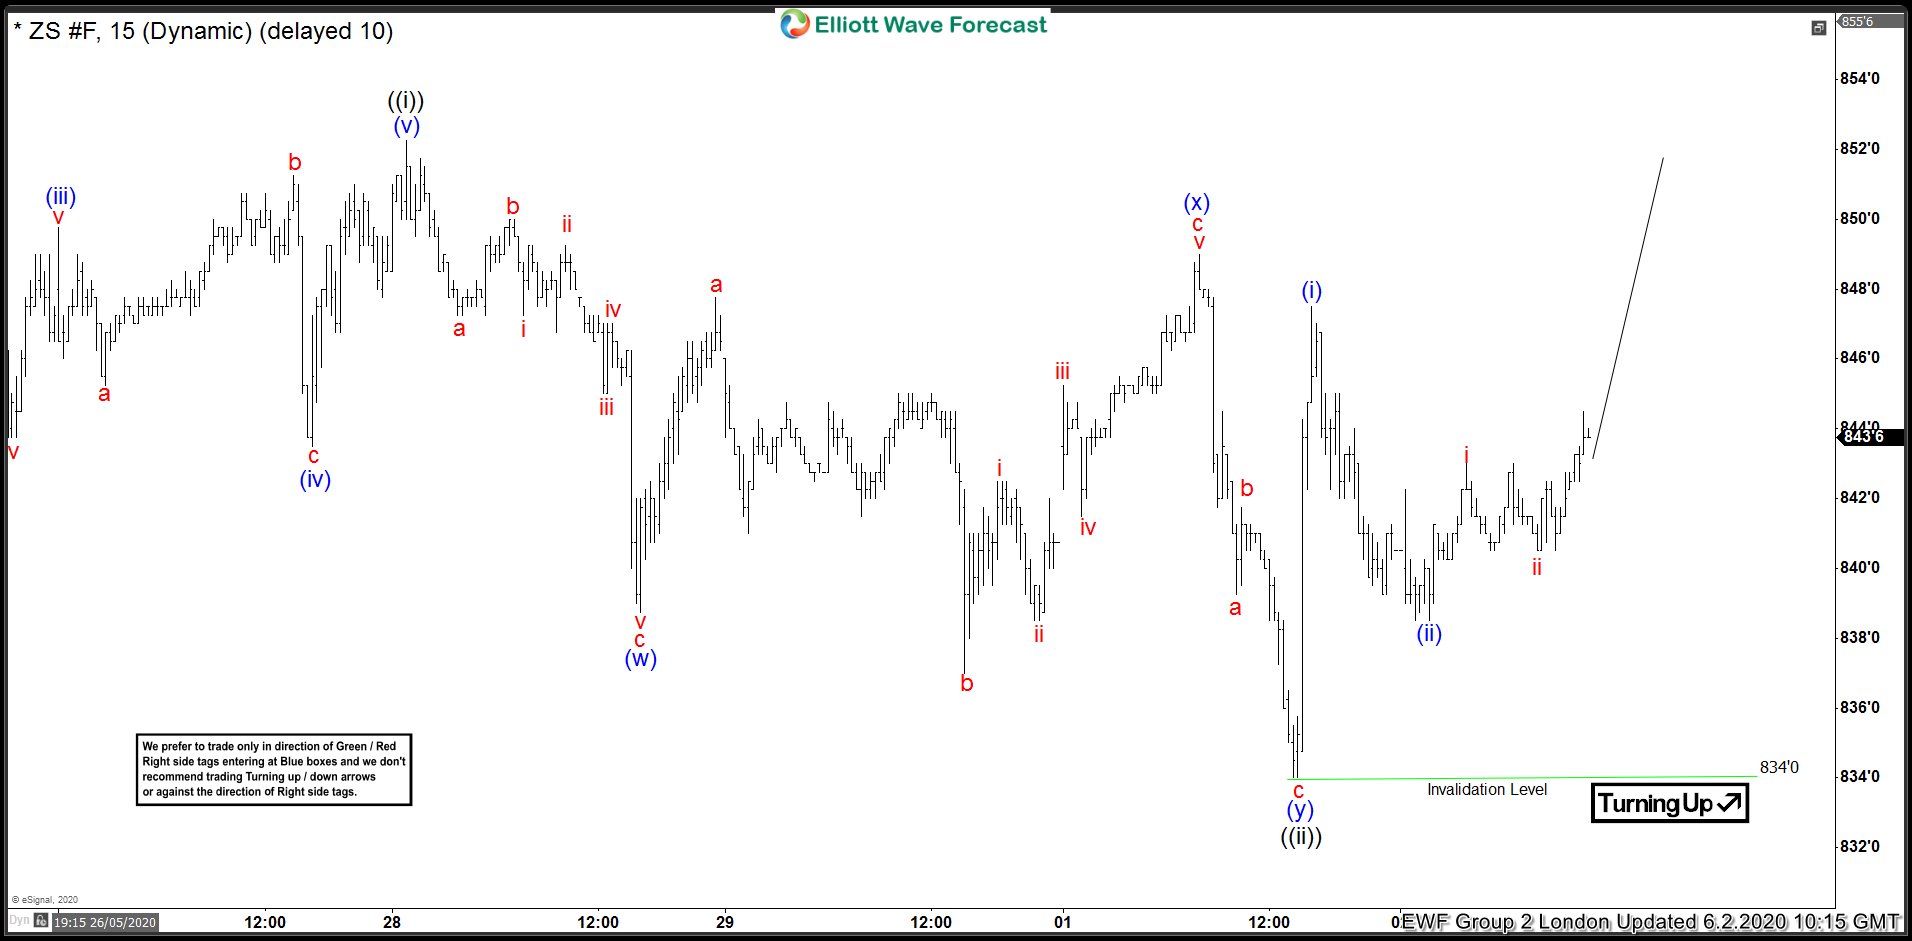
In this blog, we are going to take a look at the Elliott Wave chart of ZS_F (Soybean Futures) and how we called it higher. The 1 hour London chart update from June 2 shows that Soybean has ended the cycle from May 22 low as wave ((i)) at 852.2 high. The sub-waves of the rally unfolded as 5 waves impulsive structure. Elliott Wave theory dictates that 3 waves pullback should happen afterwards before the rally continues. Soybean then did a pullback in wave ((ii)) as a double three. Wave (w) ended at 838.6 low. The bounce in wave (x) ended at 849 high. The commodity then declined lower and ended wave (y) at 834 low. As long as that pivot at 834 low holds, Soybean is expected to continue to extend higher.
ZS_F 6.2.2020 1 Hour London Elliott Wave Update
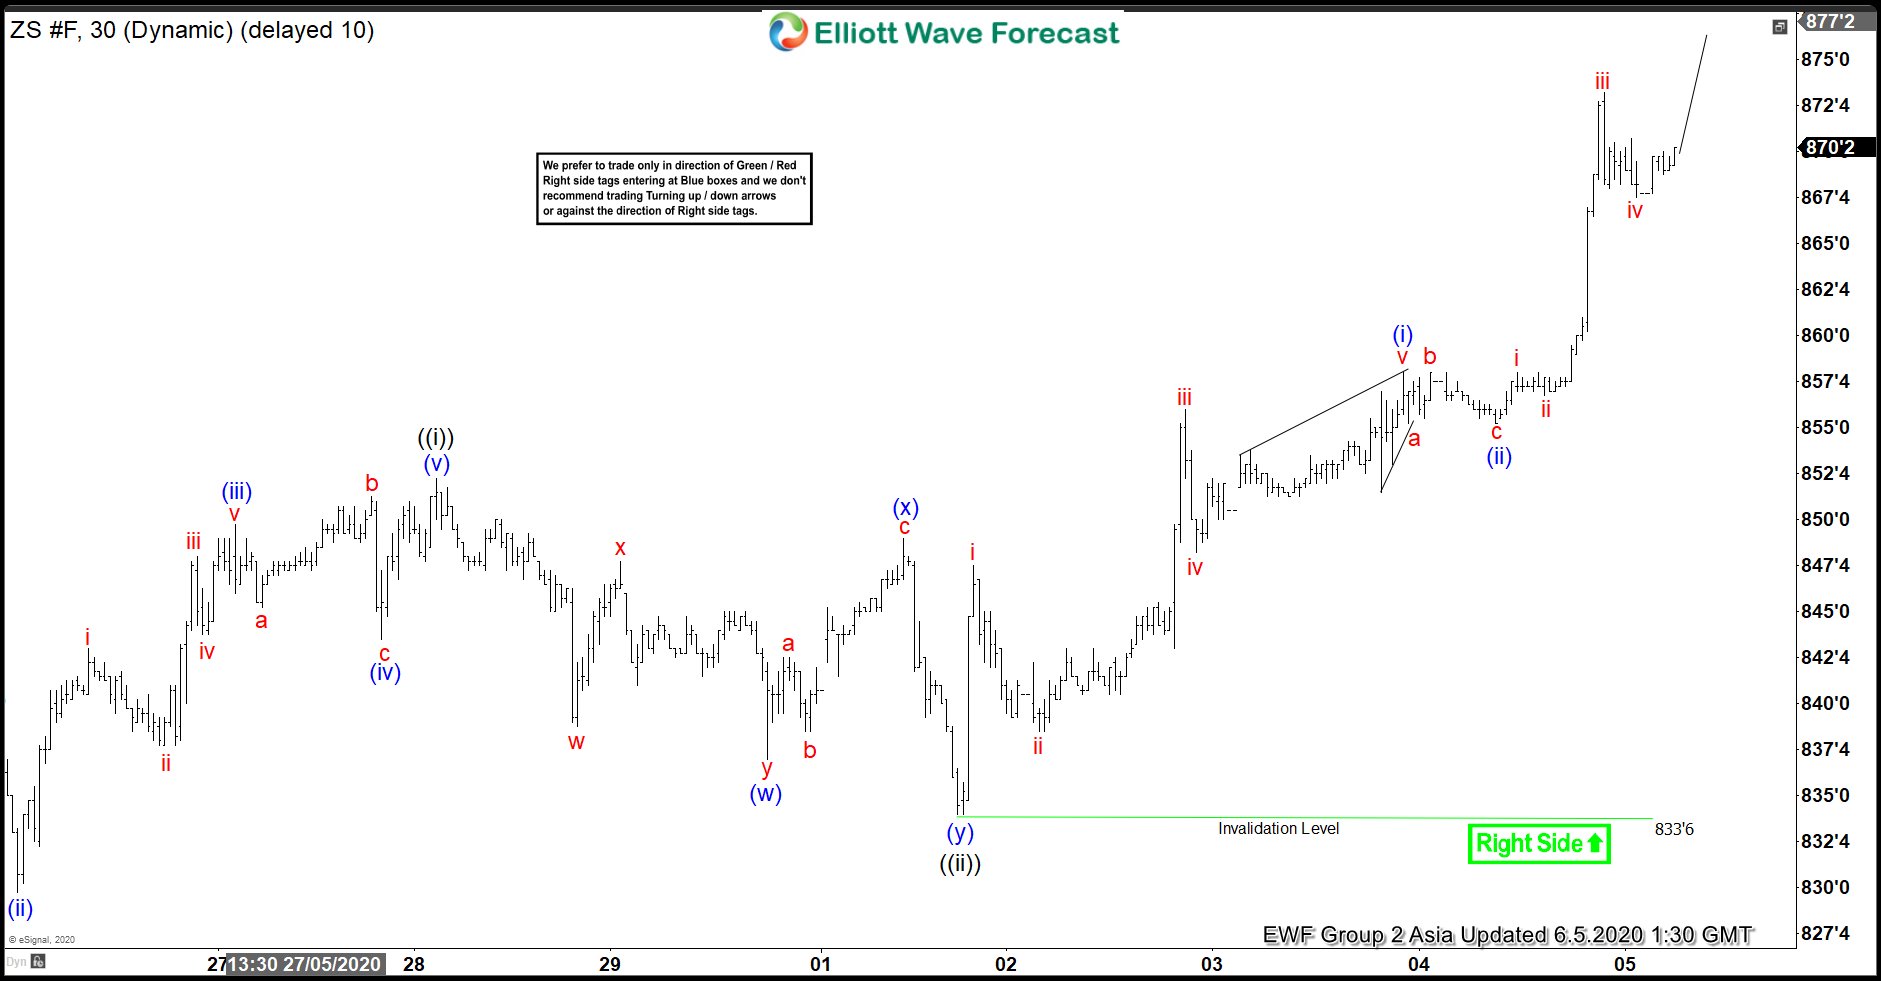
The 1 hour Asia chart update from June 5 shows that Soybean continued the rally from wave ((ii)) low. The commodity extended higher and broke above previous wave ((i)) high, confirming that wave ((ii)) low is already in place and that the next leg higher has already started.
ZS_F 6.5.2020 1 Hour Asia Elliott Wave Update
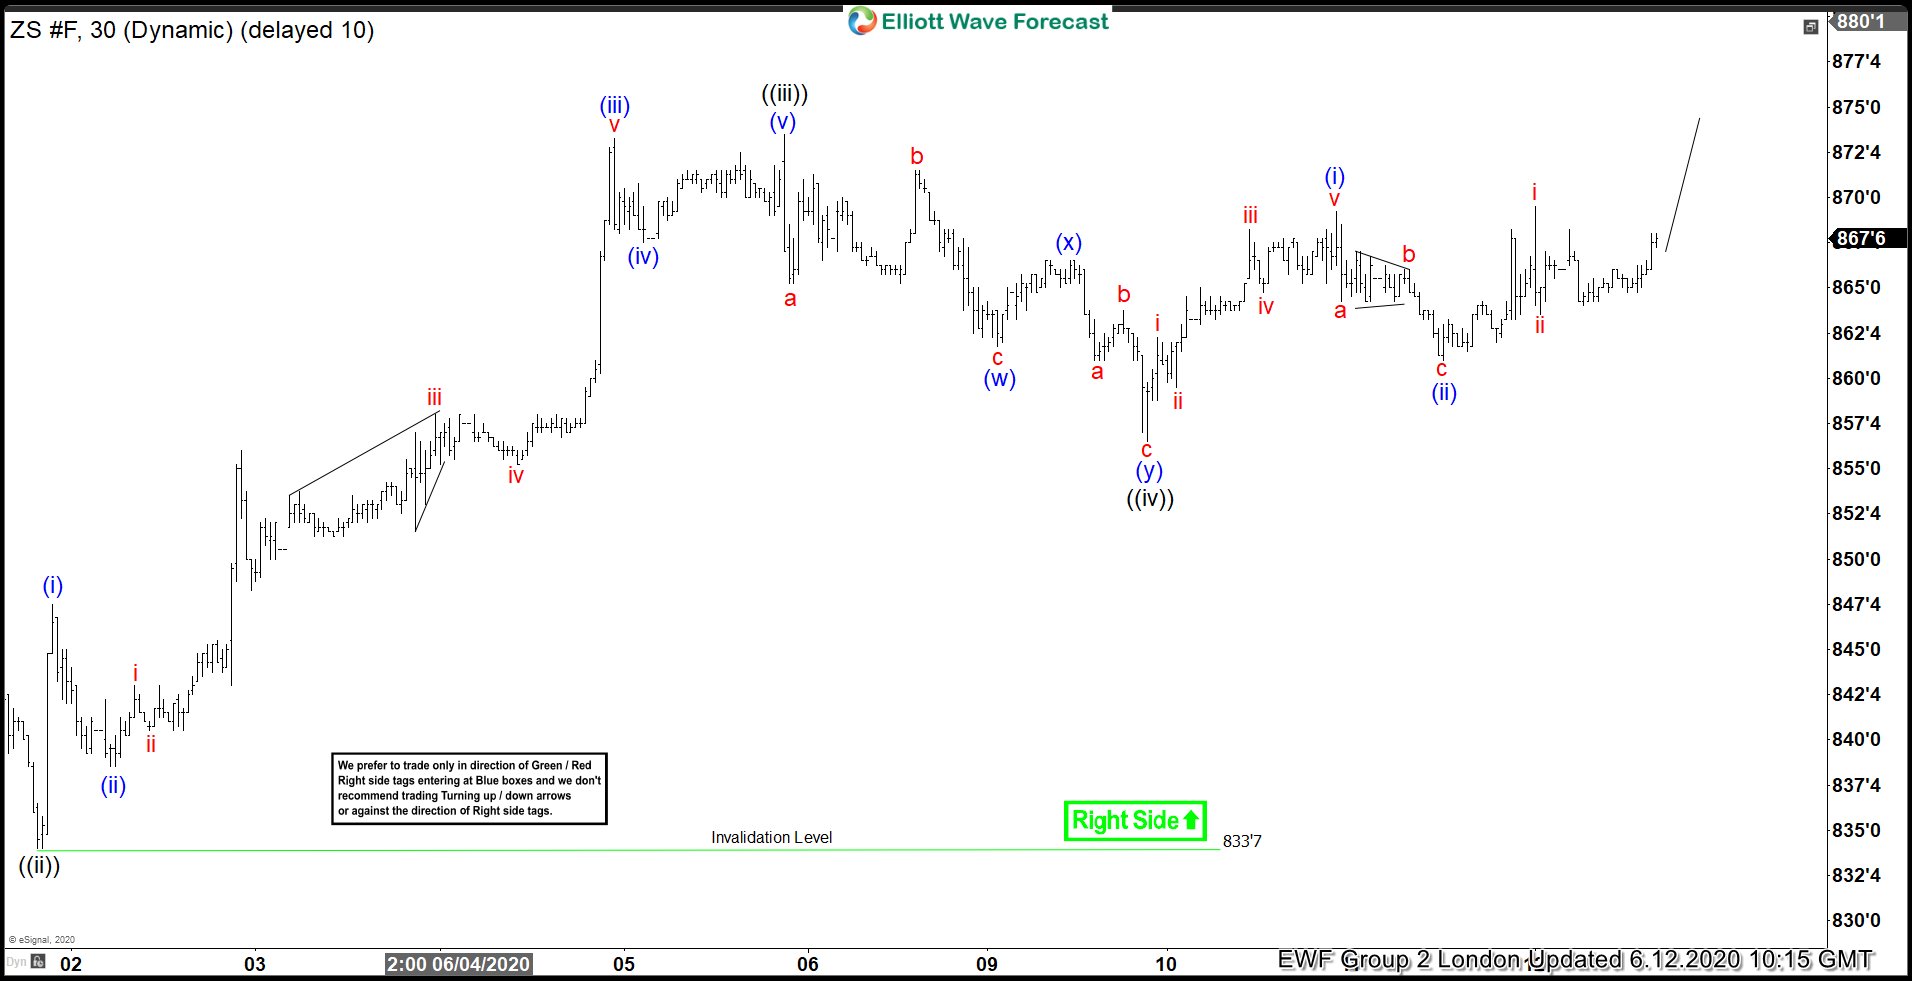
The latest London chart update from June 12 shows that Soybean ended wave ((iii)) at 873.4 high. Wave (iv) pullback ended at 856.4 low. While above 833.7 low, expect the dip in 3,7, or 11 swings to continue to find support for more upside. Soybean can still push higher in wave ((v)). However, the commodity needs to break above previous wave ((iii)) high to confirm it.
ZS_F 6.12.2020 1 Hour London Elliott Wave Update