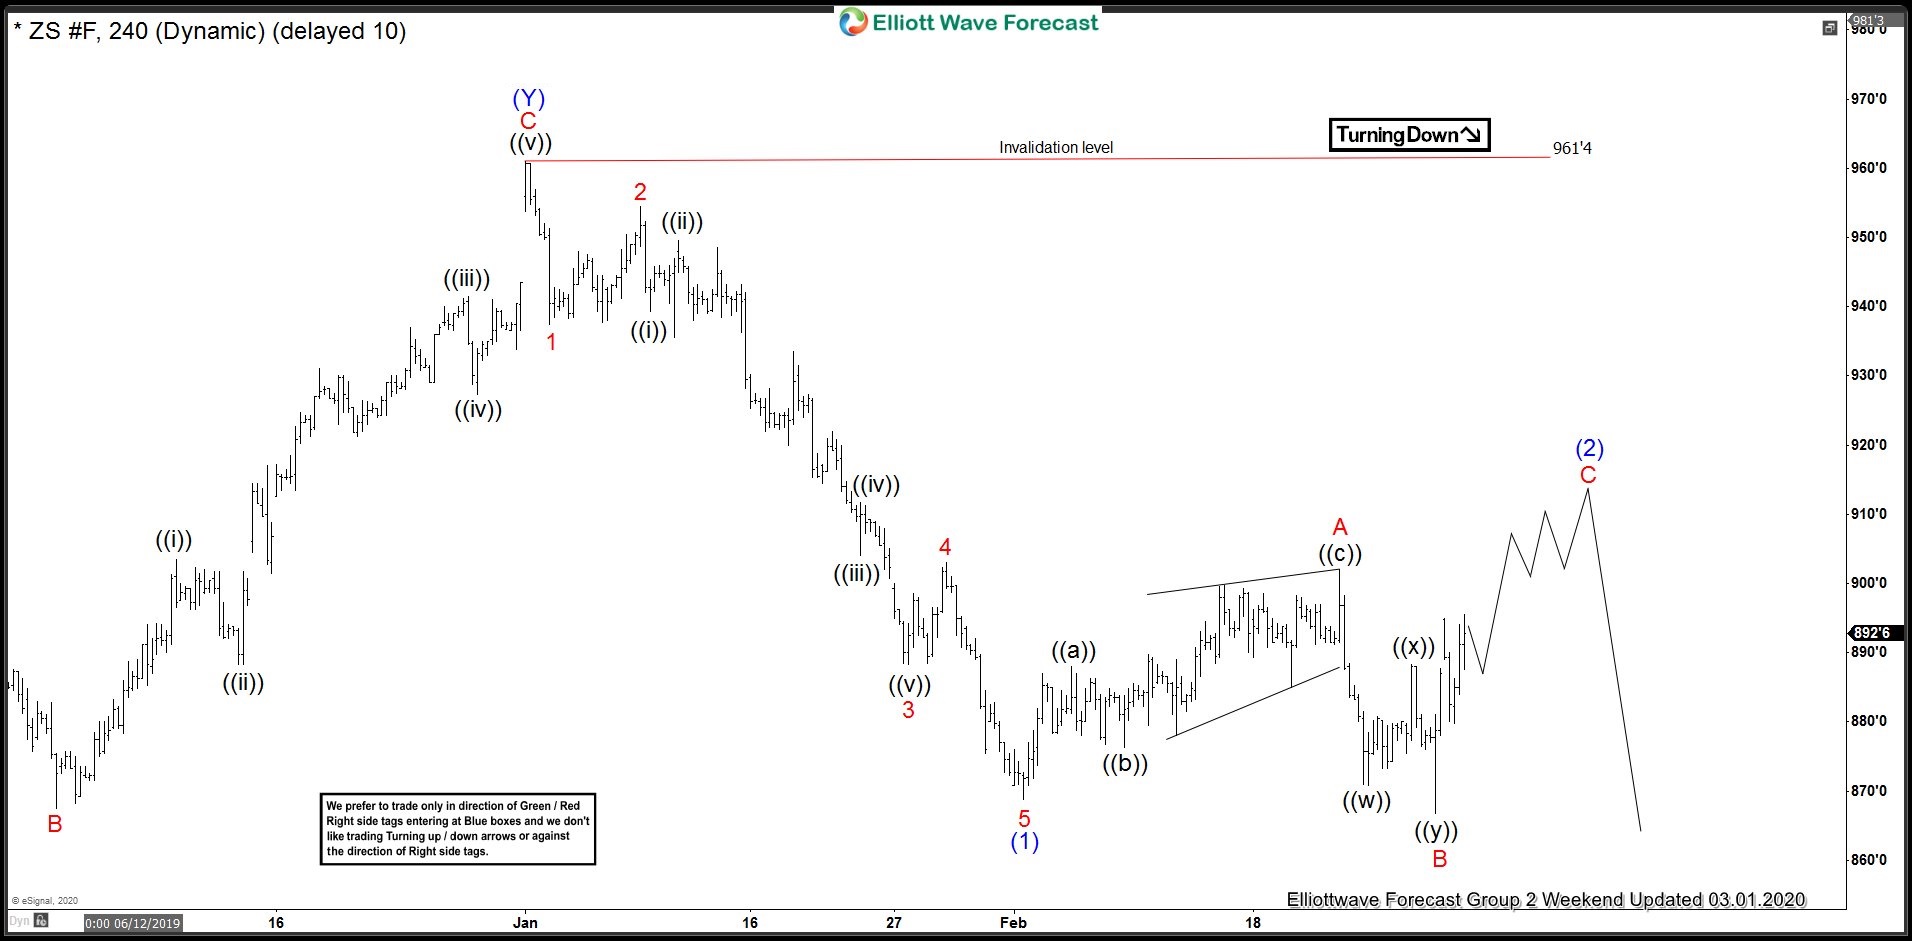
ZS_F (Soybean Futures) decline from 961’4 peak to 868’6 low was in 5 waves as 4 Hour chart below shows and thus, we expected bounces to fail below 961’4 peak for another round of selling in 5 waves. Soybean Futures bounced in 3 waves to 902’0 high and broke below the low at 868’6 suggesting next leg lower had started. However, the drop to new low was left in 3 waves as it reacted higher strongly on 2.28.2020. This indicated the possibility of an expanded FLAT Elliott wave correction and called for a break above 902’ peak to complete the pattern. As the decline from 961’4 high to 868’6 low was in 5 waves and drop from 902’0 high to 866’6 was in 3 waves, it was clear that pattern was incomplete and decline should resume below 866’6 low.
ZS_F 4 Hour Elliott Wave Analysis - 3.1.2020
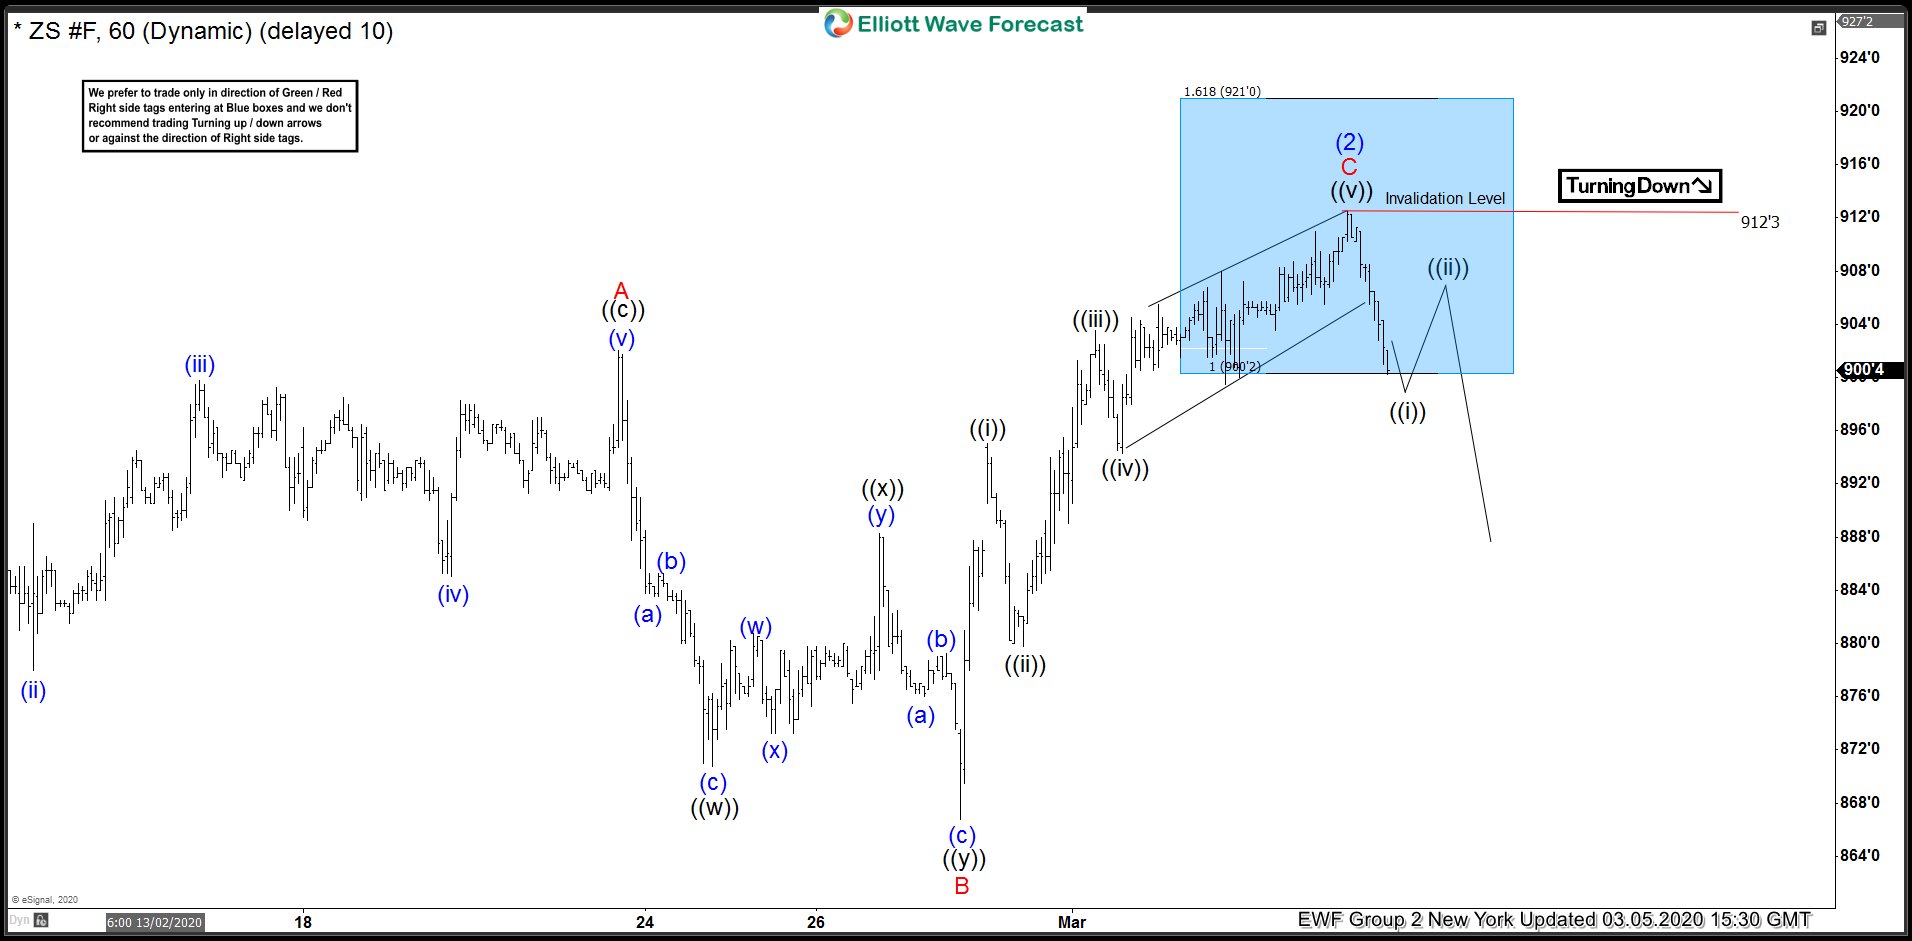
ZS_F 1 Hour Elliott Wave Analysis - 3.5.2020
ZS_F (Soybean Futures) extended the bounce as expected and reached blue box area between 900’2 - 921’0 and we expected expanded FLAT correction to end in this area and decline to resume for a new low below 866’6 low or make a 3 waves pull back at least.
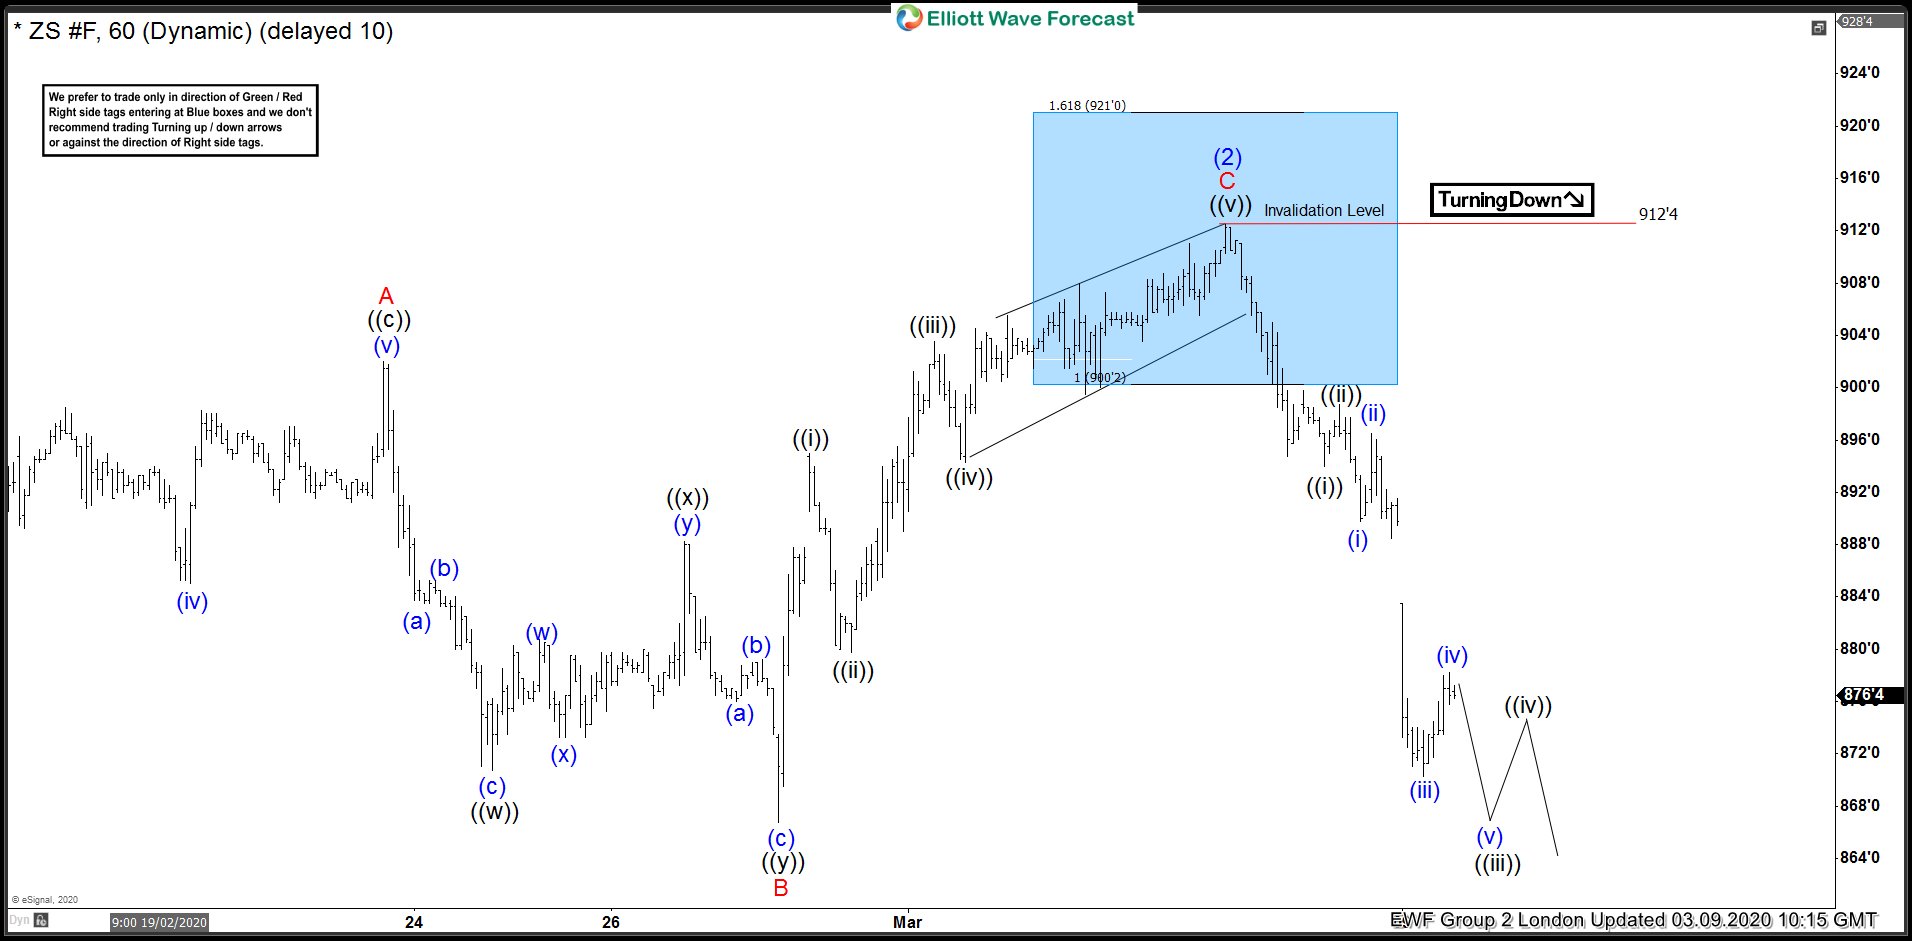
ZS_F 1 Hour Elliott Wave Analysis - 3.9.2020
ZS_F (Soybean Futures) failed in the blue box and resumed the decline as expected. Decline from 912’4 peak is unfolding as an impulse and on 3.9.2020, we looked for another couple of lows to complete wave 1 of (3) before it bounced to correct the decline from 912’4 peak and continued lower again.
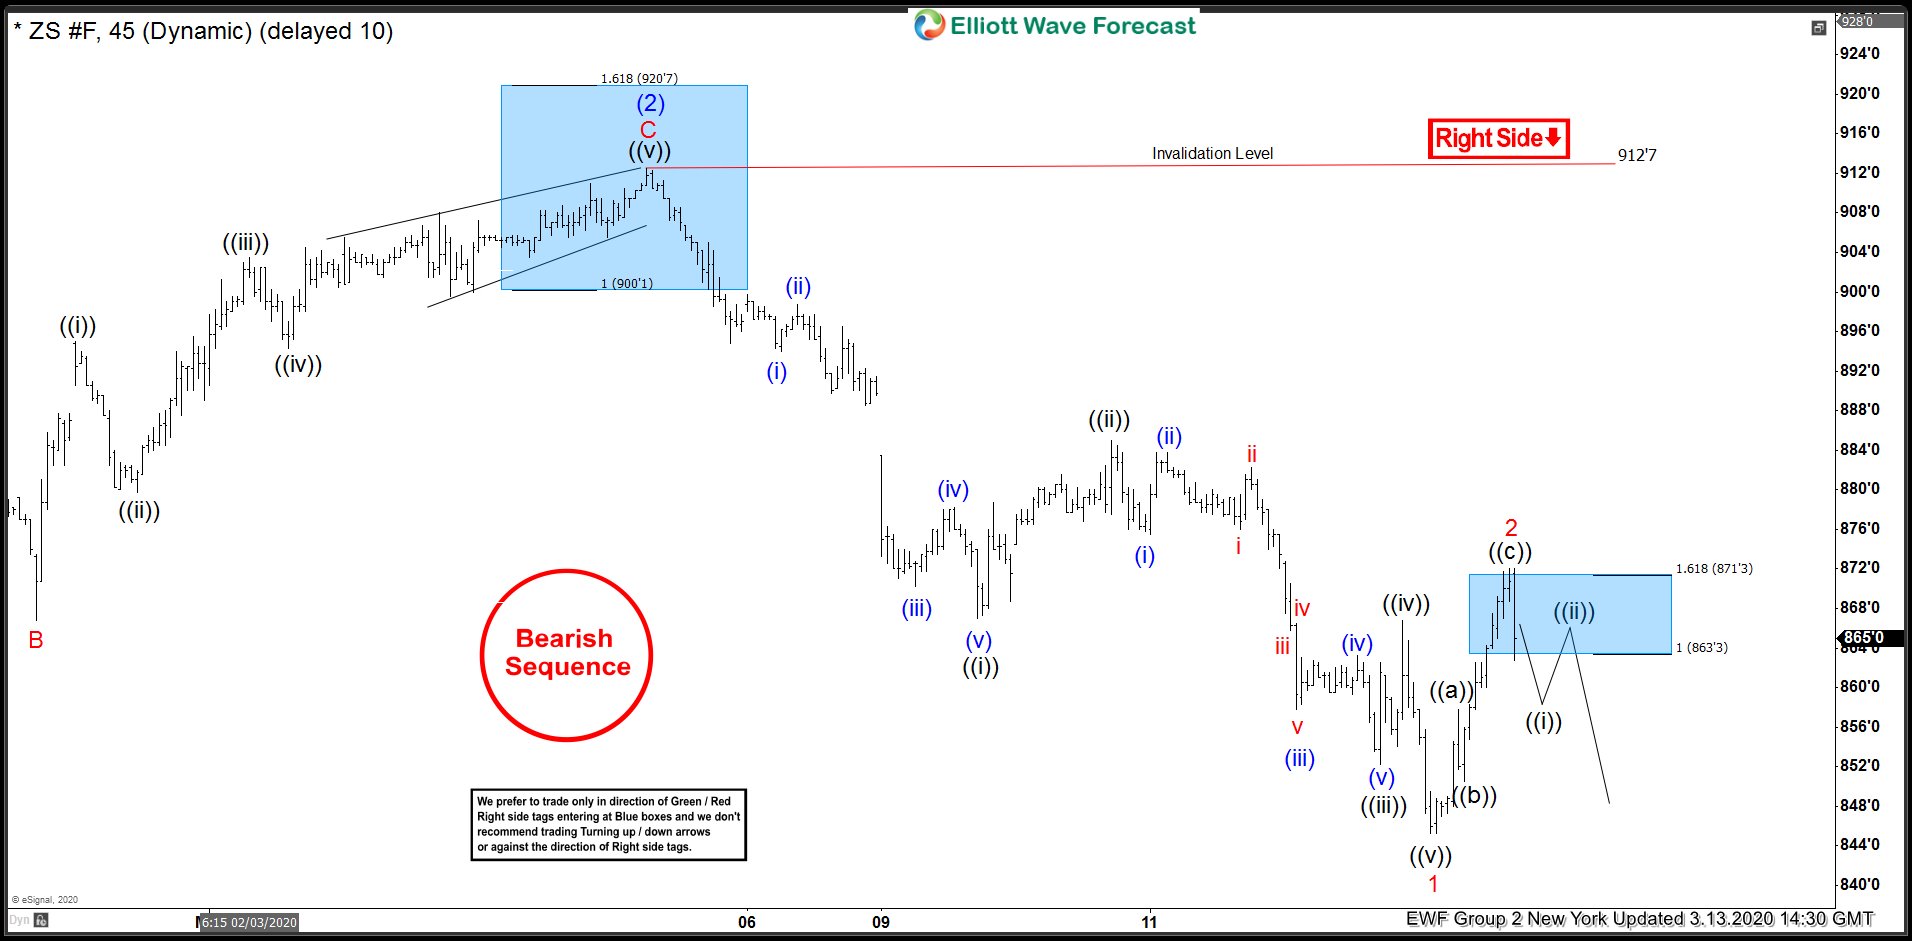
ZS_F 1 Hour Elliott Wave Analysis - 3.13.2020
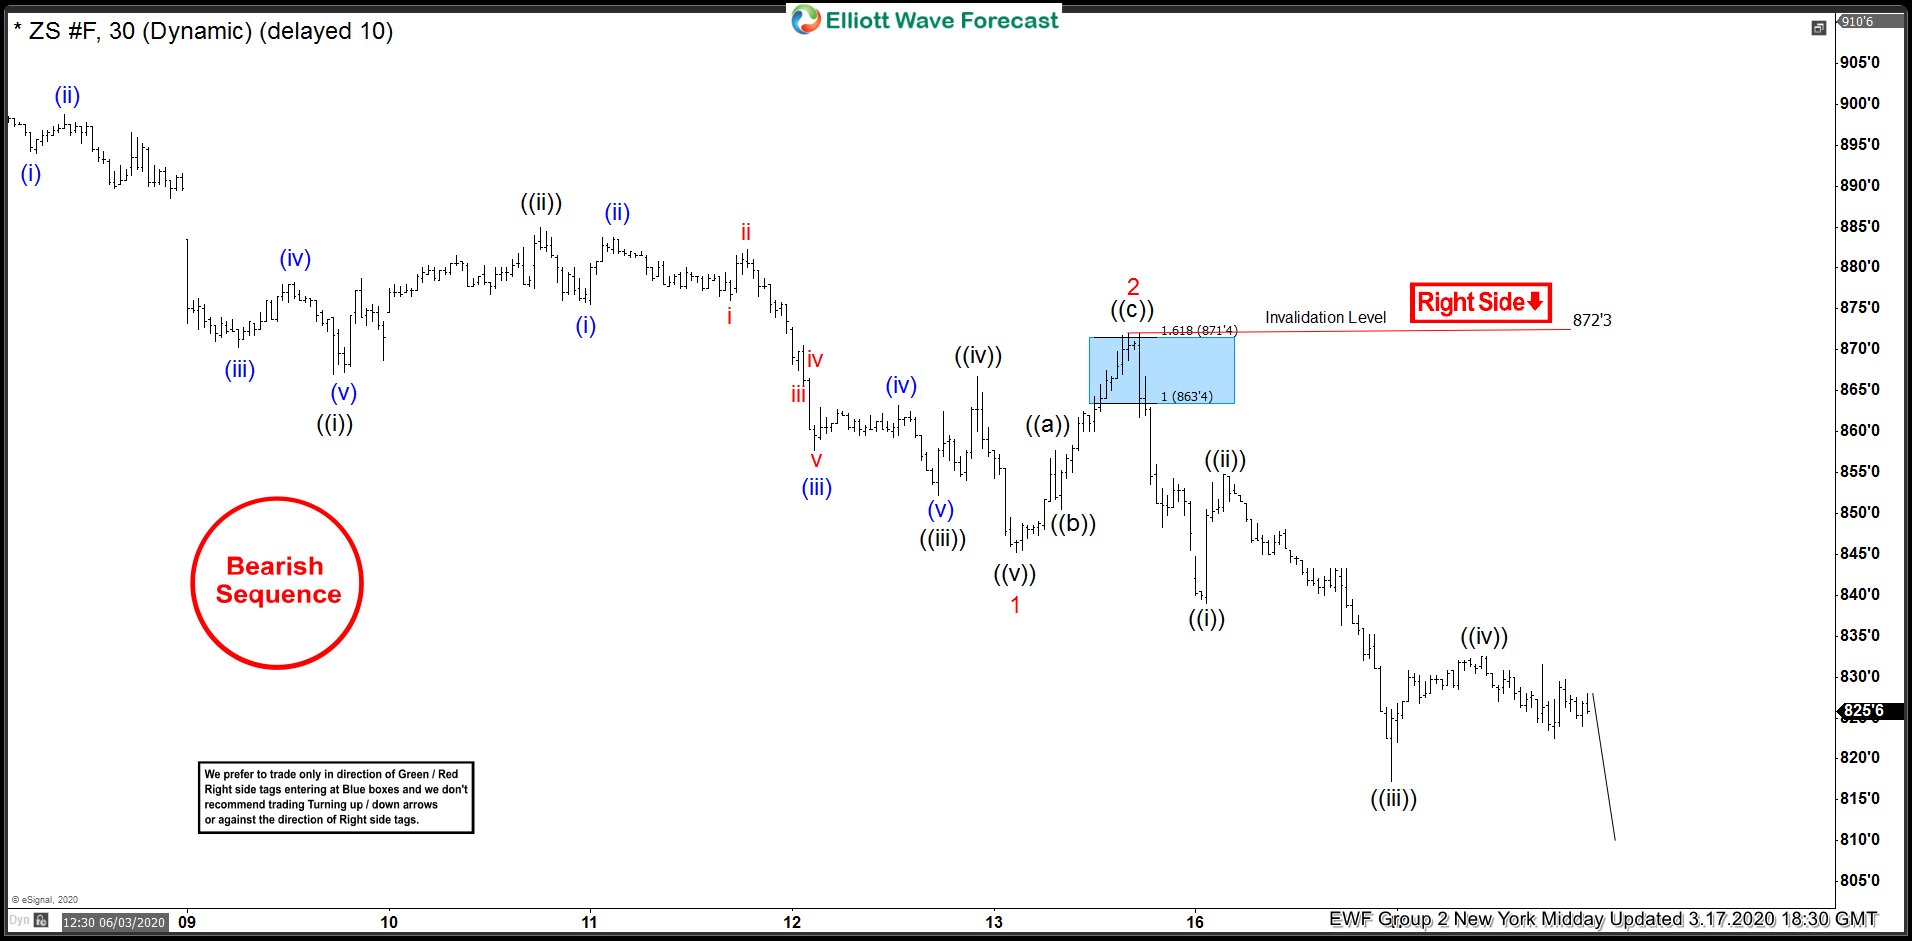
ZS_F finished 5 waves decline from 912 peak and bounced in 3 waves to reach another blue box between 863’3 - 871’3 area, we expected wave 2 to complete in this area and decline to resume for new lows or make a 3 waves pull back at least.
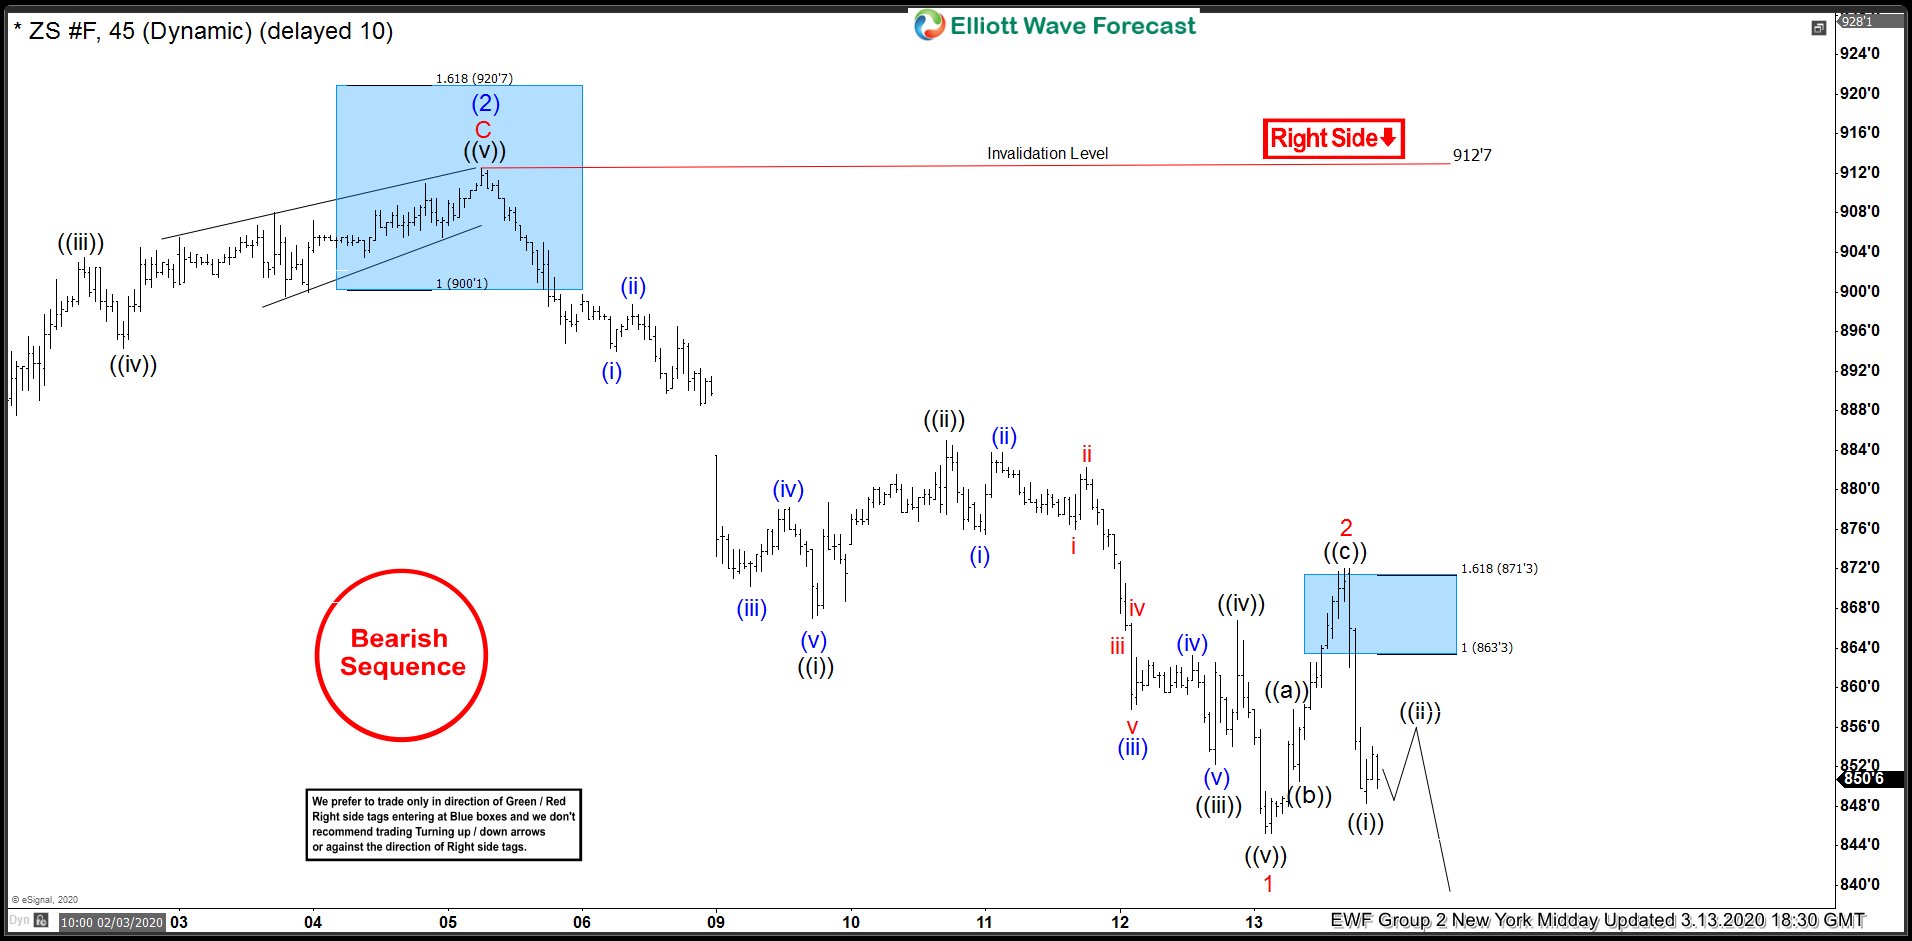
Soybean Futures 1 Hour Elliott Wave Analysis - 3.13.2020
ZS_F (Soybean futures) sellers appeared in blue box and it turned lower as expected. As bounces fail below red 2 peak, we are expecting prices to extend lower toward 818’5 - 760’3 area.
Soybean Futures 1 Hour Elliott Wave Analysis 3.17.2020
Soybean futures extended the decline and now reaching 818’5 which is 100% Fibonacci extension of (1)-(2), structure to the downside is incomplete and we still expect more downside to follow and it could reach as low as 796’3 - 760’3 area to end cycle from 912 peak.