ok, you’re COMPLETELY missing the point. Study and read more…I’ll be glad to help, but now I would only be repeating what I have already written.
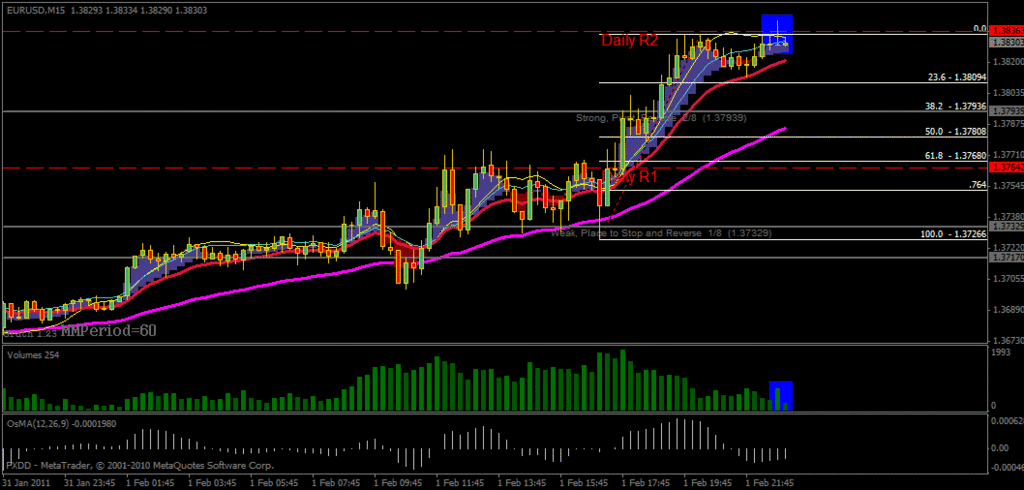
haha I know I’m missing the point thats why I am trying to post. This is a current chart like 10 minutes ago… I’m in class so I can’t post more charts right now but you should be able to see it in your mt4.
I’m really sorry I’m just trying to understand
I’v read to page 85 and taken notes on it. The concept is coming on just slowly
To put it simply, you saw a wide spread up bar on high volume as strength, when it is actually weakness. This is a rigged game, if too many traders go in one direction, price will go in the opposite direction. BTW, I don’t mean to be harsh…there is always a side of humor to me even when I’m serious. 
Ok, that explains the up bar, but what abour the down bar. I thought that would represent no sellers… why does it not?
That’s only like an 11 pip wide bar. Also, the volume at this time of the day isn’t worth trading off in my opinion - most of the liquidity is gone. Most traders have finished up for the day - certainly the big players have now that the US markets have closed. Until the Asian session gets going later on it’s pretty much just dead time now.
Best thing you can do now is review what happened throughout the day and then look for specific support and resistance zones that may apply for tomorrow’s trading. Given the effort that it took to finally get up and through the 1.3750 - 1.3780 region it’d be a fair hypothesis that this would now act as pretty strong support in the event of any pullback.
You are trying to define candles on a 1min chart out of context, give it up.
Pipbandit is right. Having said that, you have the right idea. A double top on the 15 min, second test is a pin on high volume. I would at least wait for price to begin to come down a bit before I would risk a whole position on it. That pin should be confirmed on the next bar or two by closing down, and not above the pin.
There are additional, precise entry type things to look for, but you’re first looking to spot the opportunity, which you did.
Well. I saw that candle and 'cause I know it’s pretty much dead, I took smallest loot I could with my mini account, and took 1 pip profit.  Just for fun. But that’s it. I don’t trade untill tomorrow.
Taking a chance on a short. High volume reversal.

Which is exactly why I think this move up is based on a WHOLE lot of selling.
We’ll see. It’s a big ship, and those who steer it don’t expect it to turn on a dime.
Not to go off-topic, but since MT4 is pretty much the only/best way to get Volume data, it’s important to have an easy way to get it up and running. For those of you running Mac or Linux, give this a try.
One click MT4 installation for Mac and Linux users.
Cool, I run it on Linux, if Wine is installed which you can do from your repository normally, if not goto WineHQ - Run Windows applications on Linux, BSD, Solaris and Mac OS X any Metatrader will install just like it does on Windows, MT4 runs 100%, Metatrader 5 not quite yet.
Thanks Dodge for bearing us die hard non-Windows people in mind.
But, I’ve noticed that high volumes recently on the hourly chart are a lot lower than they were only a couple of weeks ago, I’m pretty sure this is significant, in the way that it’s not really showing reversals, just signs that are too weak.
It’s a double bluff then! 
I also run it on Linux in Wine, but some customization was required to get full-functionality. This shouldn’t be required in Crossover.
My IBFX volume data for the month of Jan shows no such decline this week.

I’m on Oanda, and I can see a noticeable difference, but is it significant or relevant even?

First of all, I am totally new to this, but I have correlated the relationships with volume and price on my own when I started technical analysis without ANY prior knowledge.
But seeing I want to totally understand this basic underlying concept, I have to read through this WHOLE thread, right? Even with my 40 replies per page setting, I’m still getting 31 pages of this whole thread, that’s 1200 posts to go through…
So I really hope I am going to totally understand this when I finally get to read through the whole thing, can anybody guarantee this? hahaha
Yep - read through this thread and you’ll have a very solid base to work from. Have a read through the Master the Market book while you’re at it. Then demo it to get a feel for using it in practice and you should be good to go.
Thank you for your reply. I just want a 2% growth on my account each day… It’s my goal and in my mind I think it’s realistic, tell me otherwise though.
