2petefader:
Can you please repeat how to distinguish between distribution and re-accumulation zone? What bars should I look for?
2petefader:
Can you please repeat how to distinguish between distribution and re-accumulation zone? What bars should I look for?
Hi all, I am very interested in using volumes to help my trading. I have quickly run over a few of the first posts on this now HUGE thread!
I had a look on the current EU H1 chart and found the following (picture attached).

Surely this high volume candle indicates a weakness in demand? And, therefore, as we can see for the next 2 candles we would get a mark down?.. But then, all of a sudden we get a reversal! Can someone explain this please.
Same for the other smaller candle (1st one)?
Thanks 
Well, looks like evidence of buyers on that first candle. The second one, who knows – maybe there was a bunch of short stops that SM wanted to grab before finally breaking out of that range for markup. Or maybe there was news. Thinking back to that candle, I’m pretty sure I got stopped out. These things don’t always happen perfectly, but you’re on the right track, so keep reading 
Also, the second candle in the “markdown” area has a very low volume indicating that there might not be many sellers at that point in time - price dropped some but after a bit it looked like there wasn’t enough sellers interested to keep the run going. Price had also dipped into an area which had acted as support a couple of times recently before that. Taking those two points together it could possibly explain the reversal.
Places where I might go long… 1.4070 and 1.4000. Around those… Looks alright to me.
But these indicators say now, and they are quite colorful… :33:


haha, useless! 

OK, back to reality. I’m Looking to buy dips. Need stopping Volume on a down move to get the setup started. Untill then I wait.
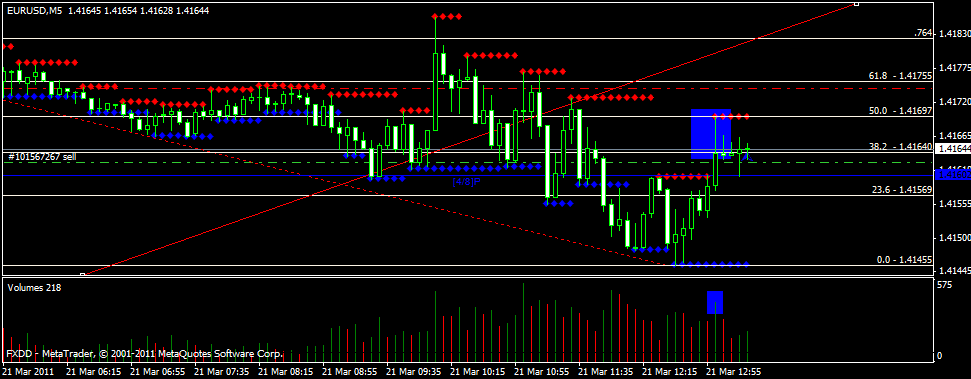
Not bad…5 min just gave a possible no supply too. An entry would be a push through it. 1.4162ish

the market seems to me as a reverser system because i want LONG in1.4154 and now is going against me should i stop it and go short.
.
Still frustrated with this method.

That hit .50 fib line, high volume and pinned off of it. I go short, and the market shoots up. I don’t understand how you saw a no supply from that?
my interpretation
So the higher volume on the price going down shows there is alot of selling… and then a red pin bar shows alot of selling when the price was trying to go up.
Volume was low in the upswing in grey you have. So why would the market go up?! why would that be no supply? I have consistantly looked at this backwards and im being driven mad.
I was talking about the first one of the two marked here…

do you mind clarifying my error with my chart?
Higher Volume on a move does not mean there is more professional money in it. That’s a key difference when using tick volume. The Volume at highs/low and .50-61.8 fib will tell you much more. Stopping Volume is key.
How is the first part demand if its a down red candle with high volume ( on the left )
Maybe I need to train my brain better. I can see the demand indicated by the wicks on the second portion you said was demand… but the first part I would have read that as supply. Why is it not?
On my chart it was at the 50% level that there was sig high volume, and atleast half the bar wicked. Thats what I don’t understand.
I’ve explained this stuff so many times. Strength is first shown on high volume DOWN bars, confirmned when price cannot continue down…inside close, doji etc.
Trending moves that hit high volume and don’t continue are hitting orders in the opposite direction.
The Volume you marked at .50 fibb is not that high considering the high volume of the day, and the markup phase on the 1hr has not hit stopping Volume, so trading along with that is only longs for now.
So, signs of a reversal up would be, high volume down bar, meets a resistance, high volume pin, reversal? and vice versa correct?
The main part that gets me is when the volume drifts lower or higher as the trend is goin up or down. Like right after your first demand I see the two bull candles that have dying volume and think that its a weak up trend, and must reverse.
Hows the proper way to interperate dying or growing volume with a trend?
Also, on your chart, the last gray box on the left, that would constitute a supply zone correct? High volume push up, then it hits a wall and high volume right back down? Is that how you analize that?
I know you repeat yourself alot, and I’v read the thread ALOT over and over. I think i get the concept then i can’t trade worth a darn.
Pete has been answered the same question over and over again… read the thread, don’t read all at once, take your time and then bring the concept into demo trading, you won’t get it overnight, me too, I’m still learning even I’ve been studying for a while now. Price doesn’t look good these days due to intervention for me…
How r ya doing, Pete? 
Boring price action…