The EURUSD Dilemma: Between Bullish Breakouts and Bearish Channels
The EURUSD pair experienced a surge in today’s trading session. It is now trading above the 50% level of the Fibonacci retracement tool. Simultaneously, the RSI indicator has flipped above the middle line, signaling a bullish trend. Despite this, the EURUSD pair remains within a bearish channel. For a bullish shift to be confirmed, bulls need to close and stabilize the price above the upper band of the flag. If they fail to do so, the bearish trend is likely to persist, particularly if the EURUSD price dips below the 50% Fibonacci level.

In summary, the current trend of EURUSD is bearish. This trend could come to an end if the price crosses above the flag. However, if the price falls below the 50% level, the bearish trend is expected to continue. Under such circumstances, the next bearish target would be the 61.8% support level, potentially extending to the 78.6% level.
GBPUSD
The GBPUSD pair is currently trading below the Ichimoku cloud, indicating a potential continuation of the downtrend. If the bears manage to close and stabilize the price below the red bullish trendline, currently at 1.2539, this would further confirm the bearish momentum. In such a scenario, we could expect the downtrend to extend towards the 38.2% Fibonacci support level.

AUDUSD Rises, But Faces Ichimoku Cloud Challenge
Solid ECN – The AUDUSD currency pair has recently broken above its bearish channel. Accompanying this shift, the Awesome Oscillator is moving above the signal line, while the RSI (Relative Strength Index) remains above the median line. These indicators collectively suggest a bullish trend. However, it’s important to note that the pair is still trading below the Ichimoku cloud.

For the uptrend to gain momentum, it’s crucial for the bulls to secure and maintain the price above the Ichimoku cloud. Conversely, if the AUDUSD price falls below the 23.6% support level, it could signal a continuation of the downtrend.
@SOLIDECN - please reply to the questions asked in this thread ?
Ignoring them and/or producing irrelevant “information” that doiesn’t answer them won’t make them go away and doesn’t speak at all well of your honesty or integrity, as people both here and in other forums are now increasingly pointing out.
 wikifx.com

US Futures Gain Post-Inflation Data; Eyes on Fed’s Next Move
Solid ECN – After the release of US inflation data, stock futures in the US saw a modest rise on Tuesday. The major averages each grew by approximately 0.2%. This increase came as the inflation figures aligned closely with predictions. Notably, headline inflation eased to 3.1%, while the core rate remained steady at 4%, as anticipated. Additionally, the monthly core rate climbed to 0.3%, and the headline rate saw a 0.1% increase, slightly above the expected flat rate.
The Consumer Price Index (CPI) report has bolstered expectations that the Federal Reserve will hold interest rates steady in its upcoming decision. However, the focus is now shifting to the Fed’s plans for next year, particularly regarding when borrowing costs might start to decrease.
In corporate news, Oracle’s stock fell about 9% in premarket trading due to disappointing revenue figures. Moreover, Alphabet’s shares dipped roughly 0.9% after losing an antitrust lawsuit to Epic Games.
USDJPY Tests Crucial Support: Bearish Trends in Focus
The USDJPY currency pair recently climbed, approaching the 23.6% support level. This particular level coincides with the previously breached bullish flag pattern. Given that the pair is currently trading below the Ichimoku cloud, it suggests a bearish outlook. Consequently, it’s anticipated that the price may decline, targeting the 38.2% support level in the near future.

Understanding the Offshore Yuan’s Recent Dip
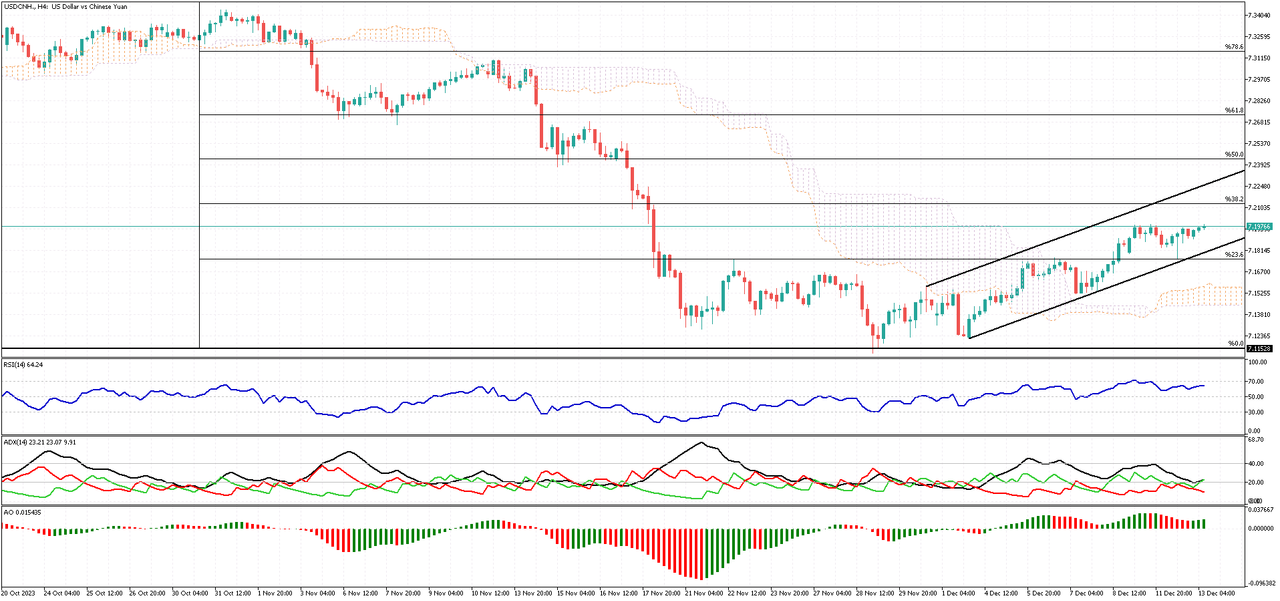
Recently, there has been a notable decrease in the value of the Chinese Yuan in international markets. Specifically, the offshore yuan’s value has dropped, approaching 7.2 against the US dollar. This change marks a significant low point for the currency, as it hasn’t been this low in over three weeks.
Details of the Policy Meeting
This decline occurred following a major policy meeting held by top Chinese officials. In this meeting, the officials discussed and set economic goals for the upcoming year. However, their announcements did not significantly encourage or uplift the market. One key point was the lack of a precise target for economic growth. Instead, the focus was on increasing domestic demand through a variety of fiscal and monetary policies.

The Economic Indicators
Investors are now keenly anticipating several important economic indicators from China. These include upcoming data on industrial production, retail sales, and unemployment figures. Additionally, there’s a heightened interest in the decisions regarding the medium-term lending rates by the People’s Bank of China, scheduled for the following week.
Recent Economic Data
Compounding the situation, recent economic data from China has shown some concerning trends. Consumer prices in the country decreased by 0.5% year-on-year in November, a more significant drop than the previous month and worse than what was predicted. Moreover, producer prices also fell by 3% last month. This decline has been ongoing for 14 months and is the most rapid since August.
Economic Implications
The Yuan’s depreciation could have mixed effects on the Chinese economy. On one hand, a weaker Yuan makes Chinese exports more competitive in global markets, potentially boosting export-driven sectors. However, it also indicates underlying concerns about the health of the domestic economy, particularly in terms of domestic demand and industrial productivity.
EURUSD Faces Key Fibonacci Resistance: What’s Next?
The EURUSD currency pair recently encountered the 38.2% Fibonacci resistance level. This significant resistance is further reinforced by the presence of the Ichimoku Cloud. As long as the EURUSD price remains below this 38.2% level, the bearish outlook continues to be relevant. Currently, if the bearish trend persists, the next objective for sellers could be the low experienced in December. Following that, the lower boundary of the established bearish channel could be the subsequent target.

GBPUSD’s Challenge with the Ichimoku Cloud: A Bearish Outlook
Solid ECN Blog – The GBPUSD currency pair recently faced a setback, unable to break through the Ichimoku cloud. Following this, it dropped back under the 23.6% Fibonacci level. When we look at the technical indicators, there’s a clear signal. The Relative Strength Index (RSI) is lingering below 50. Meanwhile, the Average Directional Index (ADX) suggests a weak trend, though its bearish line is rising above 20. Additionally, the Awesome Oscillator’s bars have switched to red, indicating a bearish trend. These indicators collectively point in one direction: they suggest that the downtrend for GBPUSD is likely to continue.

What’s Next for GBPUSD?
As long as GBPUSD remains below the Ichimoku cloud, we can expect the bearish trend to persist. The first target for this downward trend would be the 38.2% Fibonacci support level.
On the other hand, if the pair manages to rise above the Ichimoku cloud, it would invalidate the current bearish scenario.
Understanding the Bearish Signals in the AUDUSD Marke
Soldi ECN – The AUDUSD currency pair is currently trading below the Ichimoku cloud, indicating a potential shift from a bullish to a bearish trend. However, the pair has not yet fallen below the November high of 0.6525. This resistance led to a surge in the AUDUSD price, causing it to test the cloud for the second time this month. Presently, the pair is fluctuating within a bearish flag pattern, suggesting that a breach below the 0.6525 support level is probable. If this occurs, the next target for the bears could be the 161.8% Fibonacci support, followed by the lower band of the trading channel.

On the other hand, as long as the AUDUSD pair remains below the Ichimoku cloud, the overall trend is considered bearish. This suggests that traders should be cautious, as the market could continue to follow a downward trajectory.
USDCAD Tests Key Support Levels
Solid ECN - The USDCAD currency pair crossed above the Ichimoku cloud on November 12. Currently, it’s testing the cloud for support, a level that coincides with the broken bearish channel.
Technical indicators are hinting at a potential bearish trend. Yet, as long as the USDCAD pair trades above the bullish trendline (depicted in red), we can anticipate a price increase. If this trend continues, the next bullish goal might be the 50% level of the Fibonacci retracement tool.

On the flip side, should the USDCAD pair close and stabilize below the cloud, it would invalidate the bullish analysis. In such a case, the bears’ initial target could be the November low, marked at 1.34781.
Why do you lie to prospective account-holders about whether your company is regulated, and then ignore them completely when they ask for further details?
USDCHF Tests Ichimoku Cloud: Bulls and Bears in Balance
Solid ECN – The USDCHF currency pair recently tested the Ichimoku cloud after it successfully crossed above it on December 8. This breakout was marked by a long-bodied bullish candle, signaling the bulls’ determination to reverse the trend. However, the bullish momentum has since weakened, and the pair is now hovering close to the cloud. Despite this slowdown, the USDCHF buyers still have a chance to push the price towards the 38.2% resistance level. For this to happen, the price needs to remain above the cloud or not fall below the low of November 12.

Conversely, if the USDCHF bears, who appear to be more active than the bulls, manage to push the price below the cloud, the downtrend is likely to resume. In this scenario, the initial target would be the 0.86657 mark.
Sensex Shatters Records with New Peak
Solid ECN – The Indian stock market experienced a remarkable surge, with the Sensex, a major stock market index, reaching an unprecedented high. Early on Thursday, it soared by 910.0 points, a 1.3% increase, setting a new record at 70,548.4. The Nifty index also performed impressively, surpassing the 21,100 mark. This surge was primarily influenced by a positive trend in Wall Street, which followed the Federal Reserve’s decision to maintain its interest rate for the third consecutive time. Moreover, the Fed hinted at the possibility of rate cuts in the coming year.
The BSE Sensex, which had a rather quiet performance on Wednesday, rebounded with significant gains. These gains were mostly seen in sectors like IT, real estate, banking, and financial services. Investors are now keenly anticipating data from China, expected on Friday. This data includes important metrics like retail sales and industrial output for November 2023.
Market participants are also looking forward to the release of India’s wholesale price figures for November. There’s a general expectation that India’s wholesale prices might register a rise for the first time in eight months. Among the stocks that saw early gains were LTMindtree with a 3.0% increase, HCL Tech with a 2.8% rise, and Bajaj Finance also up by 2.8%. State Bank of India (SBI) also saw a 1.2% increase after its announcement of entering into a significant Line of Credit with the German Development Bank KfW, aimed at supporting solar projects in India.
EURUSD’s Recent Surge: A Technical Analysis
Solid ECN – Recently, the EURUSD currency pair has shown a significant increase in activity, managing to close above the Ichimoku cloud. It formed an inverted hammer candlestick pattern, which occurred right at the 61.8% resistance level. At the same time, the RSI indicator signaled that the pair was overbought. If the price remains under the 61.8% support level, there’s a chance it could fall to the 50% level, and maybe even down to 38.2%.

On the other hand, if the currency breaks past the 61.8% resistance level, this upward trend might push it towards the 78.6% resistance level.
AUDUSD’s Bullish Journey: A Technical Analysis
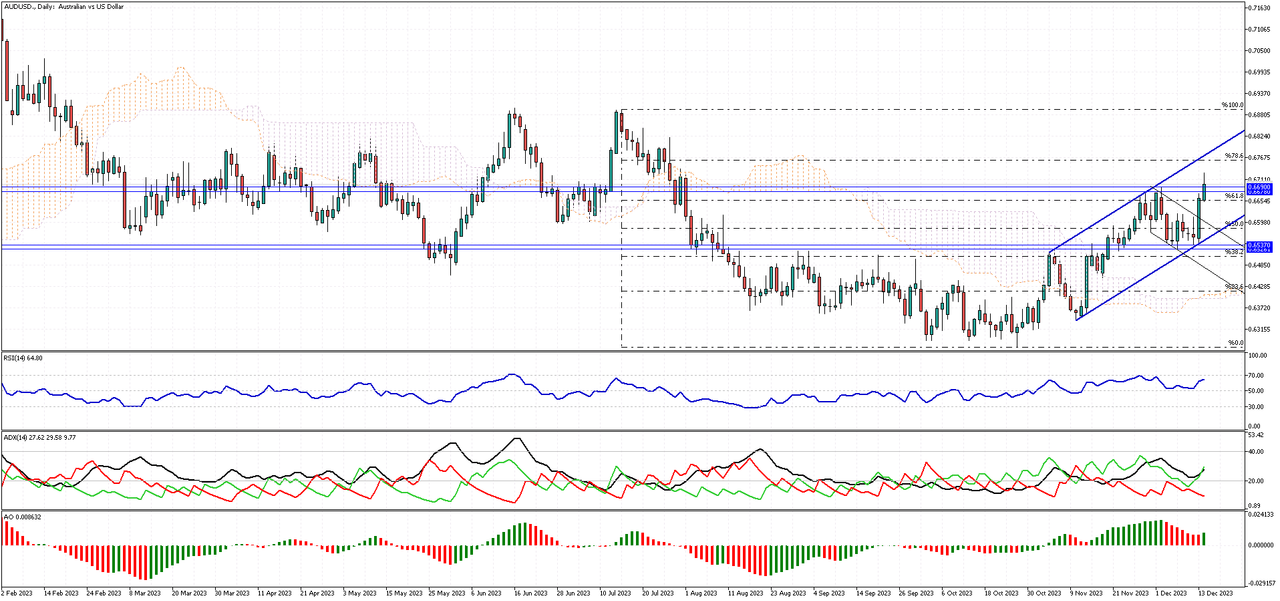
Solid ECN – In our last analysis, we highlighted the potential for a positive shift in the AUDUSD pair. Following the Fed’s cautious stance on interest rates, the AUDUSD price has indeed risen above the Ichimoku cloud.
Currently, the AUDUSD price is grappling with a previously broken resistance. This resistance area is defined by the range of 0.6678 to 0.669. Interestingly, the RSI indicator is lingering in the overbought zone, suggesting a possible consolidation phase. As a result, the price may stabilize above 0.6678.

When we take a broader look at the daily chart, we can see the AUDUSD pair moving within a bullish channel. The bulls in the AUDUSD market appear to be aiming for the 78.6 Fibonacci resistance next.
As long as the pair continues to trade within this channel, the primary trend remains optimistic.

Interest Rate Cuts Boost FTSE MIB, But Banks Struggle
The FTSE MIB experienced a modest increase of 0.5%, reaching the 30,500 mark on Thursday. This peak, last observed in June 2008, followed the Federal Reserve’s announcement of a significant 75 basis points reduction in interest rates for the upcoming year, exceeding initial predictions. Despite this rise, the Italian index lagged behind its European counterparts. This underperformance is attributed to the impact of lower borrowing costs on the profit margins of banks. Major banking institutions faced declines, with notable drops in Unicredit (2.9%), Banco BPM (4.7%), Bper Banca (5.6%), and Banca Monte Paschi Siena (4%). In contrast, shares in companies like Amplifon, Telecom Italia, and Diasorin saw an increase of over 4%. Market focus is now shifting to the European Central Bank’s upcoming decision, anticipated to maintain high interest rates. Investors are keenly awaiting any indications of potential rate cuts.
Dow Jones Hits New Heights Amid Fed’s Dovish Stance
On Wednesday, the Dow Jones was poised for a historic high following a positive response from US stock markets. This surge came after the Federal Reserve decided to keep its funds rate steady at 5.5%, aligning with expectations. Additionally, they signaled larger rate cuts for the coming year. This news boosted the three major stock indices, each rising about 1% after a stagnant morning.
The Federal Open Market Committee (FOMC) revealed its outlook, predicting the funds rate to drop to 4.75% by end of 2024. This is a decrease from their earlier 5.25% estimate. The reason behind this adjustment is the recent reports showing inflation to be lower than anticipated. However, their expectations for unemployment and economic growth remain mostly the same.
In the tech sector, major companies and semiconductor manufacturers saw notable gains. However, not all news was positive. Tesla experienced a 2% decrease in stock value after announcing a vehicle recall. Similarly, Pfizer’s stocks fell by 8% due to lowered financial projections.
Dollar Plummets to Four-Month Low
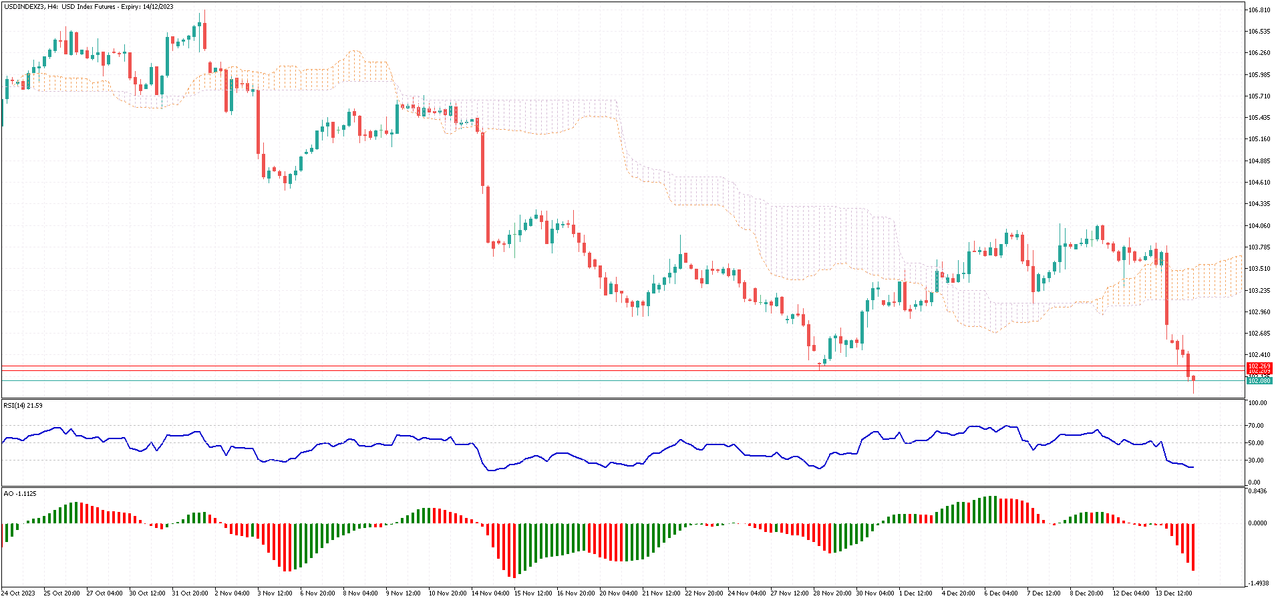
On Thursday, the dollar index fell below 102.4, hitting its lowest level in four months since early August. This drop came as investors digested the latest decisions on monetary policy and new economic data from the US. For the third time in a row, the Federal Reserve kept interest rates unchanged. They also signaled a more rapid reduction in rates for 2024, estimating 75 basis points in cuts, more than what was projected in September.

During the press conference, Fed Chair Powell maintained a dovish stance, hinting at possible reductions in borrowing costs due to a faster-than-expected drop in inflation. On the other hand, the European Central Bank (ECB) and the Bank of England decided to keep their rates steady. They committed to maintaining higher rates to tackle inflation. Despite robust US retail sales and a fall in weekly jobless claims, these developments didn’t significantly alter investors’ outlook.
Predicting NZDUSD’s Next Moves
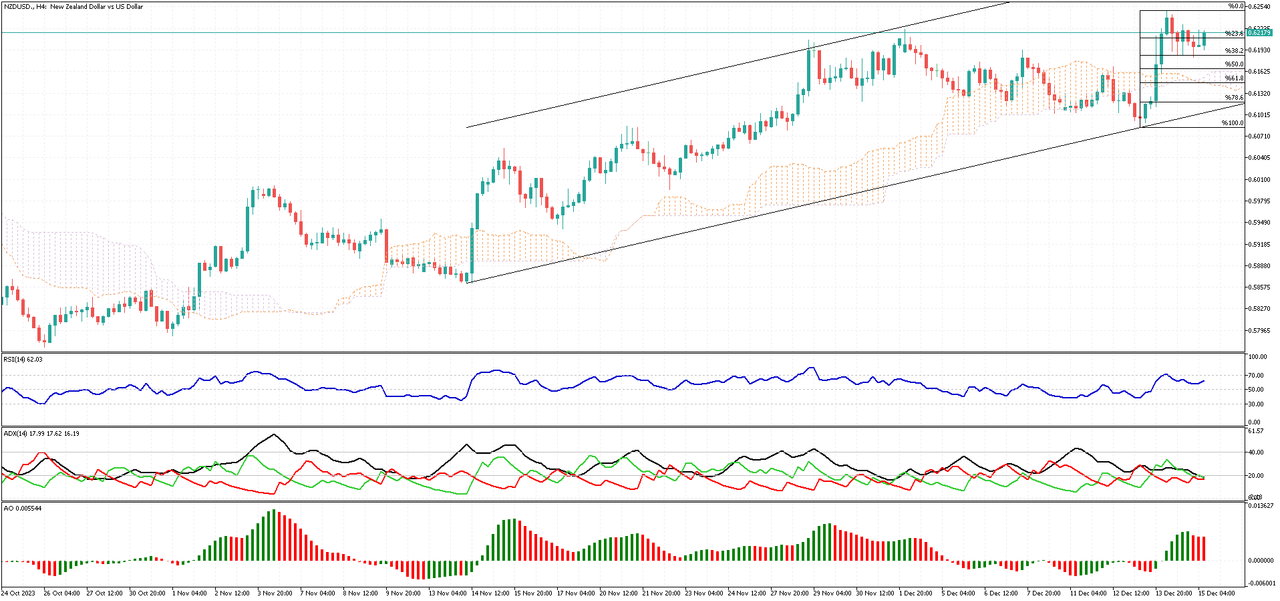
Recently, the NZDUSD currency pair reached the important 38.2% Fibonacci support level. This was something we had anticipated earlier, suggesting that the pair might regain and stabilize some of its recent increases. Looking ahead, if buyers, or ‘bulls’, can keep the currency above this crucial 38.2% mark, we could see the NZDUSD’s value start to climb.

However, if sellers, known as ‘bears’, manage to push the value below this 38.2% Fibonacci level, the pair might enter a longer phase of stabilization, possibly reaching the area known as the Ichimoku cloud.


