Euro and the Impact of Global Monetary Policies and PMI Data
Recently, the euro has been lingering just under the $1.1 level. This comes as investors are taking in a series of decisions made by central banks last week, as well as the latest PMI (Purchasing Managers’ Index) data. Last Thursday, the European Central Bank (ECB) chose to keep interest rates stable, going against some expectations of a rate cut. ECB President Lagarde emphasized that the idea of reducing borrowing costs wasn’t discussed, and any future decisions will be based on upcoming data.
In contrast, the US Federal Reserve indicated on Wednesday that its period of significant monetary policy tightening might be over, suggesting that we could see up to three rate reductions in 2024. Additionally, there’s a focus on the recent PMI numbers from Europe, which were lower than expected, showing a greater decline in the Eurozone’s private sector activities for December.
Brazilian Real Stabilizes Amid Monetary Changes
On Wednesday, the Brazilian real hovered around 4.92 per USD. This comes after it hit a low not seen in over a month the day before. The fluctuation follows key monetary policy decisions from both the Brazilian Central Bank and the US Federal Reserve. Brazil’s Central Bank recently decided to reduce interest rates by 50 basis points (bps).
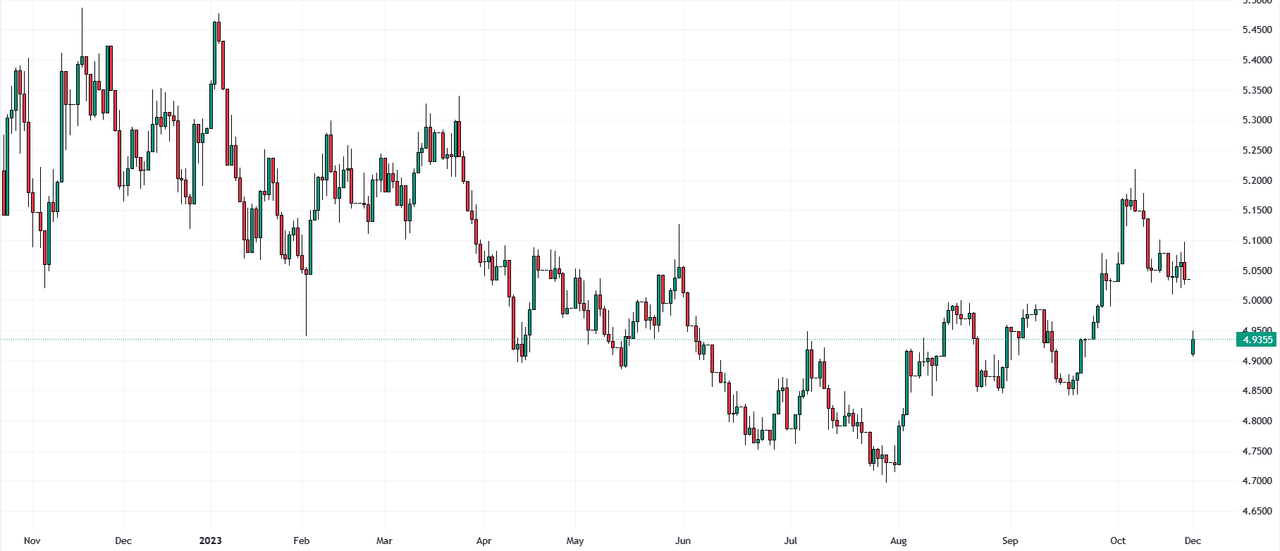
This decision, marking the fourth time the bank has committed to gradual monetary easing, was influenced by slowing local inflation and a somewhat struggling economy. In November, Brazil recorded an annual inflation rate of 4.68%, meeting forecasts and showing a continued decrease since September. Brazil’s Finance Minister, Fernando Haddad, pointed out that despite a minor GDP growth in the third quarter, the overall economy is still weakening. In contrast, the US Federal Reserve kept its borrowing costs unchanged, while projecting rate cuts totaling 75 basis points through 2024.
China’s Stock Market Dips Amid Economic Uncertainties
Solid ECN – On Monday, a sense of economic unease led to a downturn in China’s stock market, with the Shanghai Composite index decreasing by 0.4% to 2,931 and the Shenzhen Component index falling 1.13% to 9,279. These indices hit their lowest points in over a year, reflecting the growing concerns about China’s economic stability. Recent mixed economic data from November has highlighted weak demand in the country, a major point of discussion in a high-level policy meeting held last week. Despite setting economic goals and formulating policy strategies, Chinese officials were unable to boost investor confidence.
Attention is now shifting to the upcoming decision on the loan prime rate by the People’s Bank of China, set to be announced on Wednesday. The global market sentiment also suffered, influenced by comments from John Williams, President of the New York Fed, who expressed skepticism about the likelihood of rate cuts. Major losses were recorded by leading companies, with Contemporary Amperex, COL Group, and iSoftStone seeing declines of 5.2%, 11.3%, and 5.8%, respectively.
EURUSD Bullish Wave: Eyes on Fibonacci Levels
In mid-December, the EURUSD pair soared, reaching a peak of 1.1016, mirroring the November high. This notable resistance was bolstered by signals from the Awesome Oscillator, indicating divergence. Consequently, the EURUSD’s value dipped beneath the critical 38.2% Fibonacci support level, a move further backed by a previously breached bullish flag.
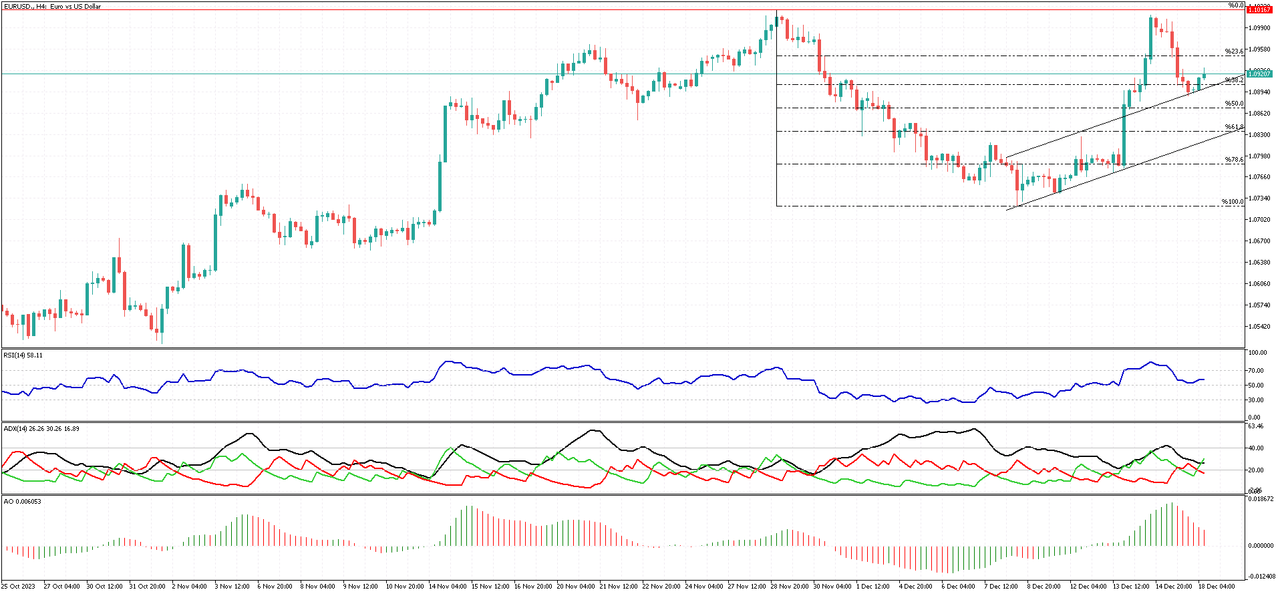
Technical analysis suggests a potential continuation of the upward trend. The ADX indicator’s green bar ascended past the 20 mark, while the RSI remains steadfast above 50. However, the Awesome Oscillator stands alone in signaling bearish possibilities.
Should the bulls successfully maintain the EURUSD above the 38.2% threshold, a fresh surge in bullish momentum is likely, targeting the recent highs. Conversely, a decline below this pivotal level could signal a prolonged consolidation phase, potentially stretching down to the 61.8% and 78.6% Fibonacci support levels.
GBPUSD’s Resistance Impact and Market Analysis
Solid ECN – After reaching the 1.2797 resistance point, the GBPUSD currency pair experienced a downturn. The significance of this resistance level is underscored by the fact that it has been a consistent point of contention throughout the trading year of 2023.
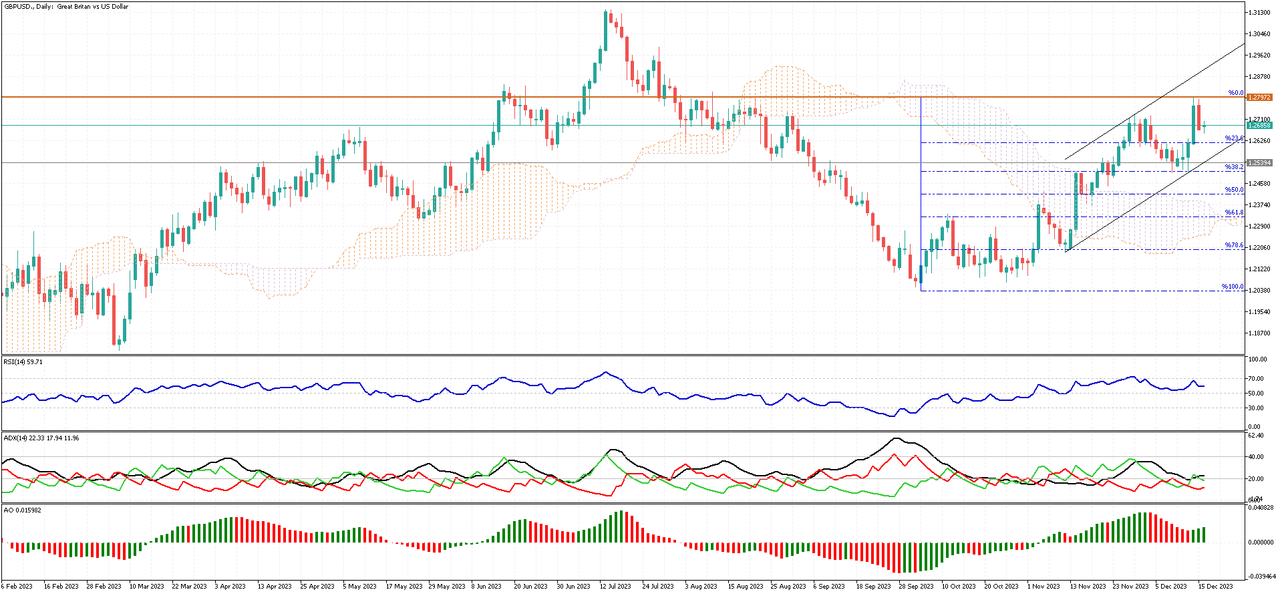
In the daily chart, the RSI indicator is maintaining a position above the 50 line, while the Awesome Oscillator displays green bars. These indicators collectively point to a robust bullish market. However, for a more detailed understanding, it’s beneficial to examine the 4-hour chart.
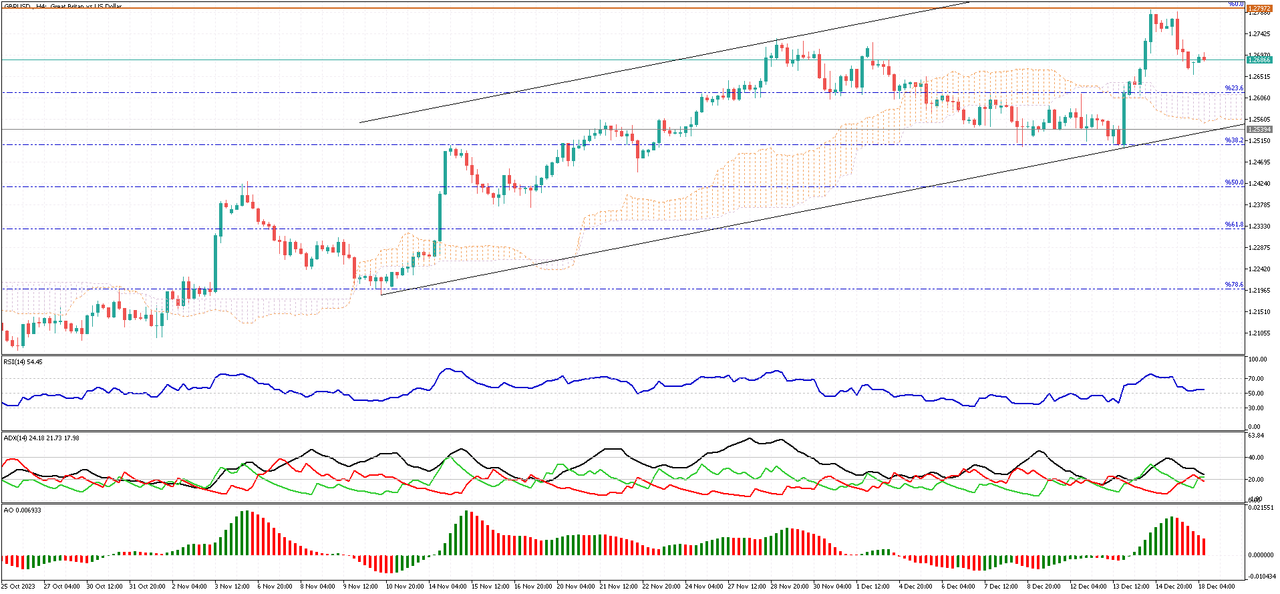
In this shorter timeframe, the technical indicators present a more varied outlook. With the 1.2797 resistance level as a backdrop, there’s an anticipation that the GBPUSD pair might see further declines. This suggests that the current consolidation phase could extend, possibly reaching the Ichimoku cloud and then the lower band of the bullish flag.
AUDUSD Stays Bullish Above Key Support
In the realm of technical analysis, the AUDUSD currency pair has impressively established itself above a key support zone, which spans a tight range from 1.6678 to 1.6690.
Turning to the indicators, the Relative Strength Index (RSI) is inching closer to the overbought threshold, indicating a strong buying interest. Simultaneously, the Awesome Oscillator and the Average Directional Index (ADX) both point towards a sustained bullish momentum. While the rising RSI does hint at a possible consolidation phase, the bullish trajectory appears likely to aim for the upper boundary of the bullish channel. This bullish sentiment is further reinforced by the 61.8% Fibonacci retracement level. As the AUDUSD pair continues trading above this level, the bullish forces are expected to maintain their dominance.

Canada’s New Home Prices Dip in November 2023
In November 2023, Canada witnessed a 0.2% month-over-month decrease in new home prices, slightly exceeding the market’s forecast of a 0.1% reduction. This decline follows a steady reading in October. A notable change was seen across 25 of the 27 census metropolitan areas, where costs either decreased or remained stable. Sherbrooke experienced the most substantial drop in prices, falling by 1.2%, with St. John’s and Hamilton closely following, each recording a 1.0% decrease. These significant reductions are primarily linked to less robust market conditions.
Conversely, new home prices in Trois-Rivières and St. Catharines-Niagara bucked the trend, rising by 0.5% and 0.3% respectively. These increases can be attributed to the escalating costs of construction in these areas. On an annual basis, the cost of new homes in Canada in November 2023 marked a decrease of 0.9%, continuing a downward trajectory that has persisted since November 2019.
NZDUSD Rises, Bullish Trend Foreseen
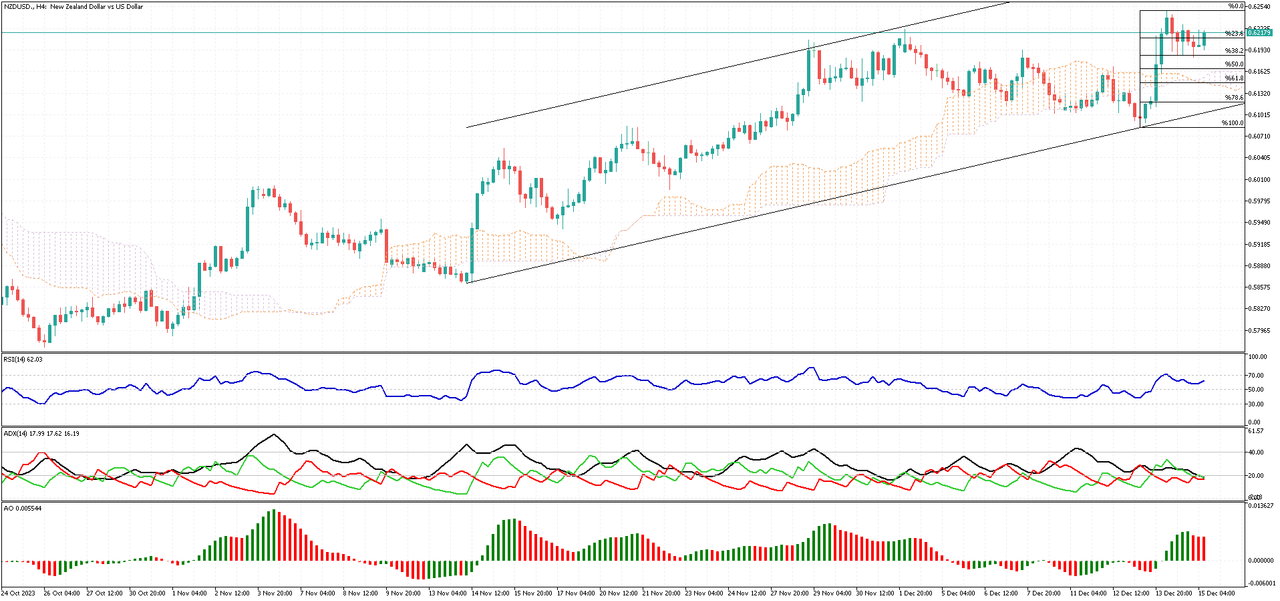
Solid ECN – The NZDUSD pair recently achieved a notable uptick, reaching the highs of the previous week, closely aligned with the proximity of the Ichimoku cloud. A glance at the 4-hour chart reveals that the ADX lines linger below the 20 mark. This positioning indicates that the NZDUSD has been experiencing a range-bound movement in today’s trading, marked by a discernible lack of momentum.

Looking at the RSI indicator, it maintains a position above 50, and the Awesome Oscillator bars present in green, signaling a positive trend. Taking these technical indicators into account, along with the overall market trajectory, it seems probable that the NZDUSD’s value might escalate, potentially targeting the upper limit of the bullish flag.
Supporting this bullish stance are the Ichimoku cloud and the lower band of the bullish flag. The bullish forecast for the NZDUSD remains valid as long as it continues to trade above these levels.
USDJPY Forecast: A Turnaround Imminent?
Since mid-November, the USDJPY currency pair has demonstrated a bearish trend, effectively establishing its position beneath the Ichimoku Cloud. Presently, it’s encountering the 38.2% Fibonacci resistance, while simultaneously, the RSI indicator is exiting the oversold zone. Adding to this analysis, the Awesome Oscillator is signaling a divergence, hinting at either a consolidation phase or an imminent trend reversal for the pair.

Given these technical indicators and the current market movements, a consolidation phase seems likely for USDJPY. This could lead to a rise in its value, potentially surpassing the 38.2% Fibonacci level. Bolstering this analysis is the 50% Fibonacci support level. However, should the price fall below the critical support at 140.76, this bullish scenario would be effectively invalidated.
Dollar Climbs Back, Awaits Inflation Data
The value of the dollar has seen an uptick, currently hovering around 102.5 this Tuesday. This rise comes after a dip below 102 just last week. The shift in momentum is partly due to comments from officials at the US Federal Reserve, who have been hinting that expectations for a decrease in interest rates might be a bit hasty.
Among the voices urging caution were Chicago’s Austan Goolsbee and Cleveland’s Loretta Mester, adding to similar sentiments previously expressed by John Williams from New York. Across the Atlantic, the European Central Bank and the Bank of England have held their rates steady, committing to higher rates in the fight against inflation. Market participants are now keenly awaiting the US PCE inflation figures, hoping for a clearer picture of inflation trends.
Shanghai Index Stabilizes Amid New Financial Rules
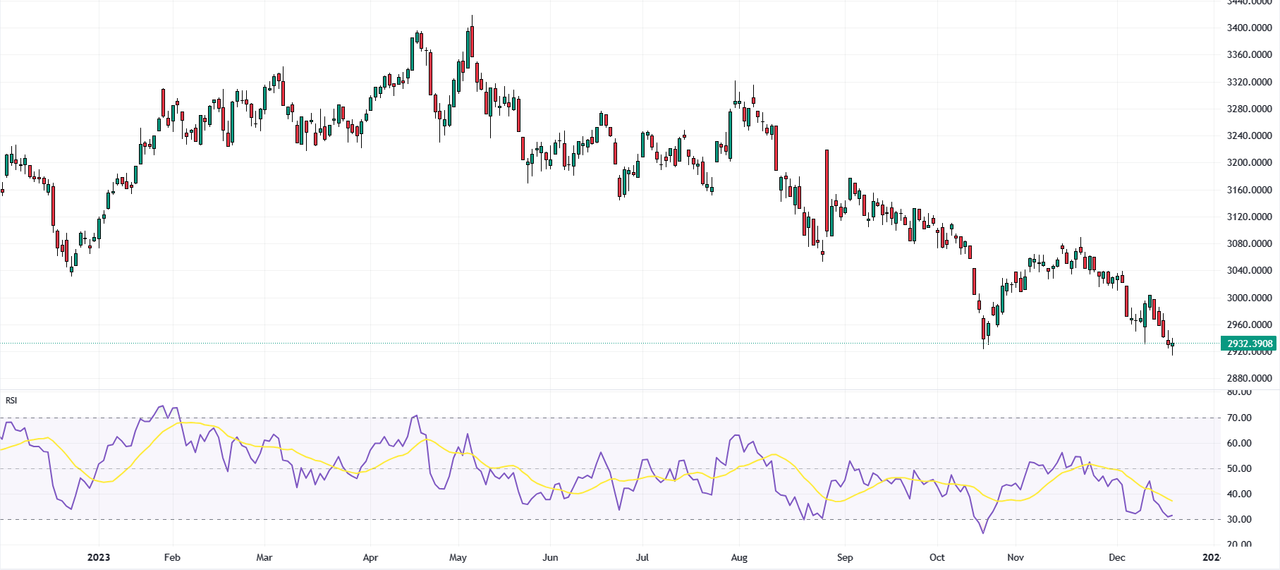
Tuesday witnessed minimal movement in China’s stock market, with the Shanghai Composite index closing almost flat at 2,932.39. This came as a contrast to the previous four days of falling figures. Market players were busy analyzing new rules for non-banking financial companies in China, set to be implemented from May 1, 2024. However, the calm of the day didn’t lift the index much, as it hovered near its lowest point in 13 months, indicating investors’ cautious approach. This cautiousness stems from the upcoming decision on loan prime rates by China’s central bank, the PBoC, due on Wednesday, and mixed reports of economic activities in China for November, driven by low demand and ongoing policy challenges.
Over in the US, the stock market futures remained mostly unchanged. Investors were holding their breath for the upcoming US Personal Consumption Expenditures (PCE) index release, a critical measure of inflation monitored by the Federal Reserve, expected to impact future monetary policy.
In the realm of corporate developments, Shenzhen L&A Design witnessed a remarkable 20% jump, reaching a two-year peak. This followed news of its subsidiary, Altron Engine Data Services, planning to invest CNY 435 million in new computing servers. Other significant market shifts included CSSC Science & Tech rising by 5.6% and Kangxin New Materials gaining 3.3%. In contrast, Jiangsu Boxin Investing and Citychamp Dartong Co experienced drops of 7.2% and 2.3%, respectively.
BoJ Holds Rates Steady in Year-End Meeting
The Bank of Japan (BoJ) concluded its final meeting of the year with a unanimous decision to keep its key short-term interest rate at -0.1% and the 10-year bond yields close to 0%, as anticipated. The central bank also decided to maintain the flexible upper limit for long-term government bond yields at 1.0%.

Amidst significant uncertainties both domestically and internationally, the BoJ committed to persist with its monetary easing policy. The board emphasized its readiness to adjust to changes in economic conditions, prices, and financial stability. The ultimate goal of the BoJ is to sustainably reach a 2% price stability target, ideally alongside rising wages. The committee also expressed its willingness to implement additional easing measures if necessary. Recently, the central bank governor, Kazuo Ueda, acknowledged that wage growth is trailing behind the increase in prices, casting doubt on the sustainability of the inflation target level.
Swiss Franc Climbs High, Supported by SNB
The Swiss franc has risen past 0.87 against the USD, reaching its highest level since the end of July. This surge is partly due to a temporary dip in the dollar’s strength and ongoing support from the Swiss National Bank. Recent dovish comments from Federal Reserve officials hinting at potential rate cuts next year have put pressure on the US dollar.

Meanwhile, the Swiss National Bank has been actively supporting the franc by selling off its foreign currency reserves. This strategy helps to mitigate the impact of fluctuating commodity prices and keeps import inflation in check, a crucial tool in combating high price growth in Europe. Latest reports show that the Swiss National Bank’s foreign exchange reserves have decreased for the sixth consecutive month, hitting a seven-year low in November. On the policy side, the central bank maintained its key interest rate last week and indicated that, despite a slowdown in the country’s Consumer Price Index (CPI), inflation risks are still present.
Rand Dips as Dollar Stabilizes
The South African rand is currently trading at about 18.6 against the US dollar, a slight decline from its recent one-month peak of 18.3. This change comes as the dollar finds stability, influenced by several Federal Reserve policymakers who expressed hawkish views. These officials are challenging the extent of the interest rate cuts that the markets were expecting for next year.
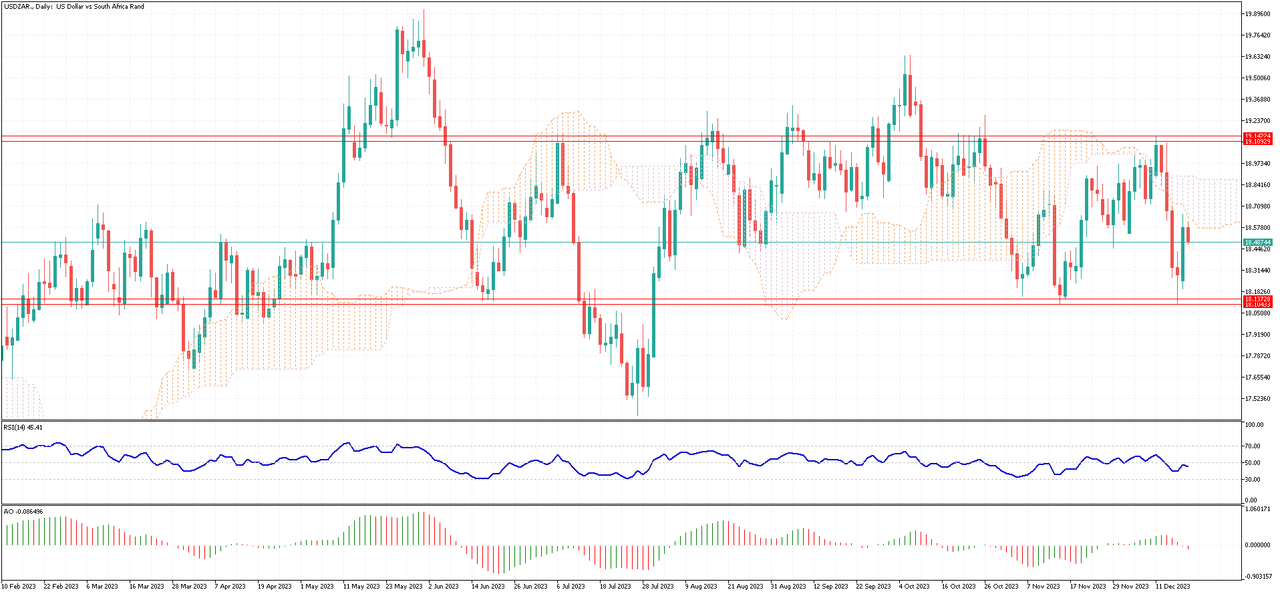
In South Africa, the Reserve Bank decided to maintain its main lending rate at 8.25% for the third consecutive meeting on November 23rd, a rate that hasn’t been this high in 14 years. The bank continues to highlight ongoing inflationary risks. Notably, the annual inflation rate in South Africa decreased to 5.5% in November 2023. This is a drop from the five-month peak of 5.9% seen in October and brings it nearer to the central bank’s target range of 3% to 6%.
Hungary’s Central Bank Cuts Rates Amid Slowing Inflation
During its December 2023 meeting, Hungary’s central bank lowered its key base rate by 75 basis points to 10.75%, aligning with what analysts had predicted. This decision was made as inflation shows signs of slowing down. Similarly, rates for collateralized loans and overnight deposits were decreased to 11.75% and 9.75%, respectively. However, the central bank is standing firm against government calls for deeper rate cuts aimed at stimulating the economy.
In November, the country saw a 7.9% year-on-year rise in consumer prices, the smallest since January 2022, yet still well above the central bank’s target midpoint of 3%. The bank predicts a steady reduction in inflation, expecting it to fall to about 7% by the end of 2023, and to re-enter the target range by 2025. Looking forward, policymakers are likely to continue their current approach to rate cuts, mindful of the potential risks of an economic slump in Hungary.
BoJ’s Steady Policy Boosts Tokyo Stocks
On Tuesday, the Nikkei 225 index rose by 1.4%, reaching 33,219, its highest point in two weeks. The broader TOPIX index also saw an increase, finishing 0.7% higher at 2,334. These gains followed the Bank of Japan’s decision to maintain its ultra-easy monetary policy, with a commitment to keeping interest rates low. The bank, however, did not provide any clues about potential changes to this policy in the next year.

Most sectors ended the day lower, except for basic materials, which remained relatively unchanged. Real estate emerged as the standout sector, leading the gains, followed by technology and non-cyclical industries. Among individual companies, Tokyo Electron saw a significant increase of 3.7%, with Fast Retailing and Recruit Holdings both gaining 2.2%.
Rising Consumer Confidence in the Netherlands
In the Netherlands, December 2023 marked a noticeable uptick in consumer confidence, reaching its peak since January 2022. The confidence indicator improved to -29, up from -33 the previous month. This positive change reflects an enhanced outlook on the overall economic situation.
Specifically, people felt more optimistic when considering the past year (-62 compared to -66) and the year ahead (-19 compared to -28). Moreover, there’s a growing readiness among consumers to spend, evident from the rise in their willingness to buy (-21 compared to -24). Importantly, perceptions about financial prospects for the coming year turned positive, moving to 2 from -1. Finally, households viewed the current period as slightly more favorable for major purchases, with the sentiment improving to -40 from -42.
Gold’s Rise and Resistance: Fibonacci Analysis
FxNews – In the daily XAUUSD chart, gold recently rebounded from the 50% Fibonacci support level. Now, the metal is trading over the 38.2% Fibonacci support, approaching the resistance zone between $2,047 and $2,057.

Delving deeper with the 4-hour chart, we get a clearer picture of gold’s market movements. Here, buyers are striving to keep the price over the 38.2% Fibonacci mark. This bullish trend is backed by various technical indicators. For instance, the RSI indicator is consistently above 50, a good sign for buyers. Moreover, the Awesome Oscillator shows green bars, signaling upward momentum. If this trend continues and the current level holds, we anticipate gold might reach the 61.8% Fibonacci resistance.

Conversely, if gold’s price falls beneath its current support, this would challenge the current bullish perspective, potentially leading to a decline in its value.
UK Gilt Yield Hits 8-Month Low Amid Rate Cut Hopes
Solid ECN – In the UK, the 10-year Gilt yield has dropped to 3.5%, marking an eight-month low, driven by expectations of interest rate cuts in 2024. UK inflation has also decreased to 3.8%, the lowest since September 2021, beating the expected 4.4%. The core inflation rate fell to 5.1%, a low not seen since January 2022, and significantly under the 5.6% forecast.
This has led traders to heavily speculate on the Bank of England reducing interest rates, with predictions of a total cut of 143 basis points. The initial rate cut is expected in March, followed by potentially five more quarter-point reductions, and a 70% likelihood of a sixth cut. In the meantime, the markets are also anticipating a 75 basis point rate cut from the Federal Reserve in 2024.
Rising Aussie Dollar: A Five-Month High
The Australian dollar has maintained a strong position, staying around $0.675, which is its highest level in nearly five months. This strength is largely due to the dovish (less aggressive) monetary policies of the US Federal Reserve and the Bank of Japan. These policies have put pressure on the US dollar and the yen, in turn boosting other major currencies, including the Australian dollar, commonly referred to as the Aussie.

Furthermore, the Aussie has been positively influenced by an increase in commodity prices. This rise in prices can be attributed to supply disruptions caused by attacks in the Red Sea. Additionally, the possibility of lower interest rates has also played a role in enhancing the overall demand outlook, thus supporting the Australian dollar’s value.
Domestically, the situation is also noteworthy. The latest meeting minutes from the Reserve Bank of Australia (RBA) revealed that the central bank had contemplated raising interest rates for a second consecutive month in December. However, the RBA opted to wait for more data before making such a decision, as there were promising signs regarding inflation.
The RBA has also observed that aggregate demand within Australia has slowed more rapidly than they had anticipated. This slowing of demand is coupled with an observation of an accelerating pace of disinflation (a slowing down in the rate of inflation) in other parts of the world. These factors together contribute to the complex economic landscape that the RBA and the Australian dollar are currently navigating.


