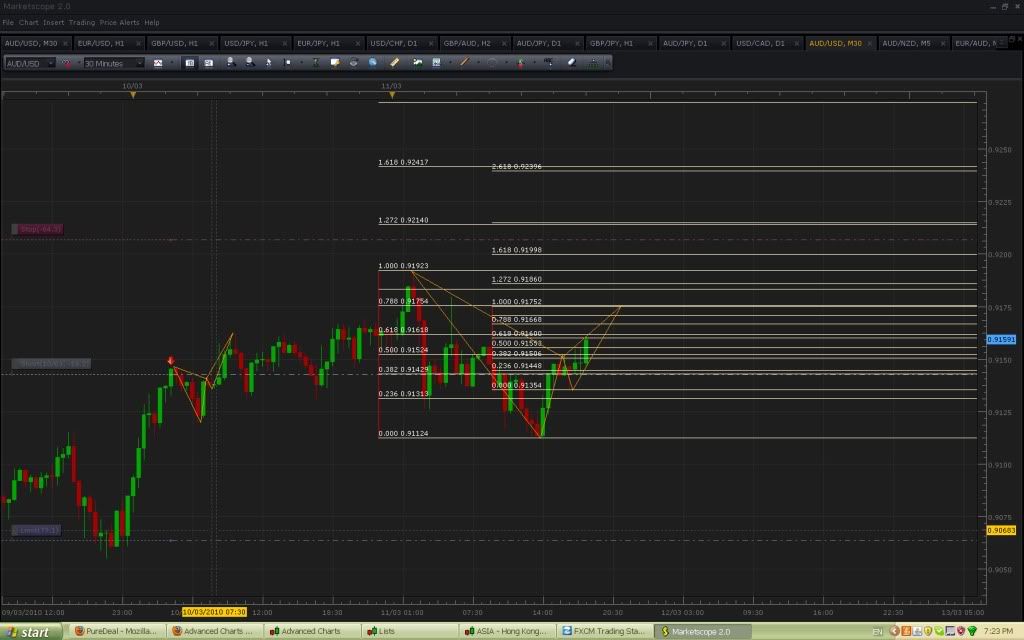
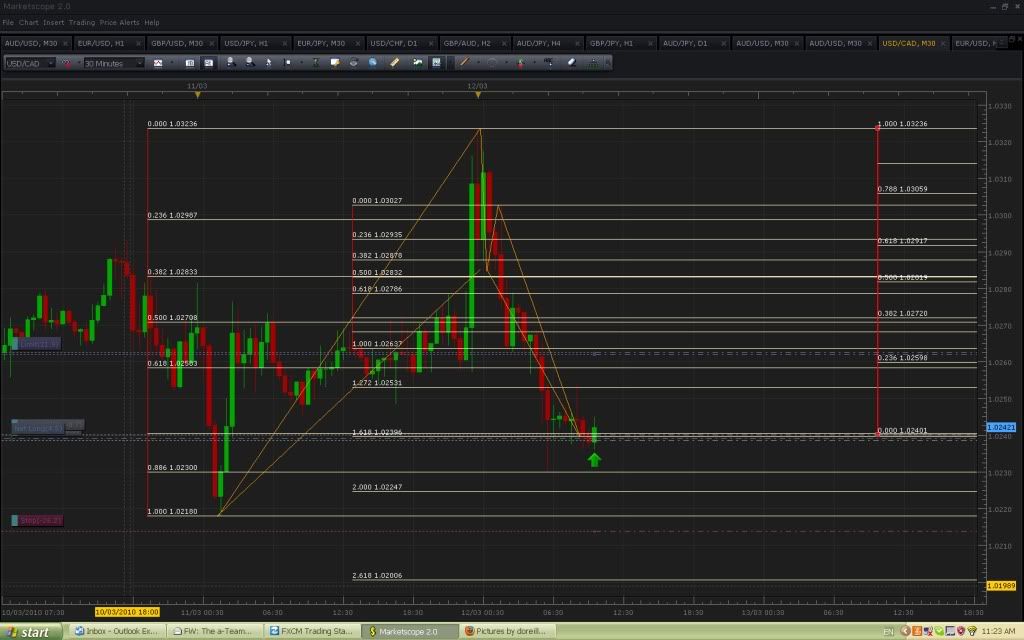
either way, the trade was well considered and adhered to my trading plan, so regardless of the result it’s a win.
and btw, great trade to be long and nice exit.
hey guys, sorry I’m not on my normal computer but I thought you’d all like to know this. I can’t post a picture of it sadly, maybe when I get home later I will be able to. But i have a pattern forming very nicely on the EUR/USD. (if you look at it on a 4hr chart it is easiest to clearly see). X is 1.3436 A is 1.3736 B is 1.3532 C is 1.3705 and D has a perfect convergence at 100% of BA and .786 of XA at at strong psychological price of 1.35000. Many reasons to take it and it looks good. Check it out if you are interested. I’ll try and post a pic later.
Could someone please post a chart on a daily frame or any high TF with a gartley or butterfly on mt4 so I can see what to look for?
Go back to page 155 on this thread. There are a few pictures of gartleys using MT4 that I posted there. If you look around on this thread you’ll see many people using it. Really it’s all the same. The patterns don’t change, only the background.
Could someone please tell me if this pattern is correct? untitled.jpg Photo by pullice | Photobucket
Hey pullice, Yep, thats a valid pattern, been looking at it myself…
Thanks nightfox, its pretty simple if you know what you doing,  I got a warning from babypips for posting a link to my chart, now I dont know how to show my charts without getting banned?
I think that’s because of the number of posts that you have. Now that you’re 50+ you can add links to your posts.
Would you say becase the BC leg was so short? Showing implicit bullish strength?
Here is a decent pattern on the EURUSD… only thing is the convergence is at the 1.00 XA.

Honestly I don’t give much importance to that, there were another factors that made me take this trade.
Overall bearish direction, AD price action had corrective behavior (candles with short price range), symmetry, time, multiple convergences, oscillator was showing divergence at D, trendline acting as resistance at D, etc.
Long previous candle to D was a warning sign though.
I had enough reasons to trade the pattern. I’m sure there are another technical evidence against the trade, but can’t get into that much signals that at the end of the day would take me away from every single pattern.
Hi Racerdude,
I know it’s an after the fact chart, but zoom out your chart and take a look at the upper trendline acting as resistance.
Hey pullice,
Can just use imageshack… they give you a forum code for the uploaded image, copy and paste in in your post, and voila, the image shows up.
And I use resize to 17" monitor for my images.
- nightFox
Hmmm, dunno why my chart shows better convergence for the EURUSD @ 0.786/1.618 compared to the one posted by racerdude…
Should be my data feed?
Edit : Nevermind, my drawing was a bit off. But then again it doesn’t look like a very good convergence, then again i could be wrong…
Hi guys,
Well here I am again talking my book. The short au trade has been slow and painful, with the pair trading bullishly given the relatively weak data over the past couple of days. I’ve been living in hope over that period which is never a good sign.
So with that in mind let me show you a short pattern haha. Note there are additional convergences above, just beyond my stop…gulp, so enter at your own peril.
Good luck today,
Modo.
took this weak pattern, been looking for a long on this pair for a while. good chance it will end in tears.
TMB , Eager to learn from your analysis , Waiting for your posting. ALL IS WELL. - ALTOFX


