Just wanted to hear from you all if you have a different approch when choosing your X point? The thing i find most difficult when doing patterns trading is where you should put your X. The failed patterns i trade mostly fails becouse i should have choosen a diffrent X.
I know Wrtm uses an approch with Elliot Waves? Would be great if you could explain a little bit how you do this?
It’s more a matter of spotting strong areas of support and resistance. The more confluence you have at that point, the more likely a reversal will occur in that area.
What kind of confluences? Well of course the basic fibs for the pattern. And some other fibs of your choice. From previus highs/lows, from different swings, pivots, support and resistance lines, etc.
As for the Elliot Wave approach that I use, I only consider valid a pattern which structure has strong characteristics of being an Elliot Wave pattern.
I you are familiar with the basic concept of Elliot Wave, you’ll easy find out that a completed Elliot Wave structure could also fall in the category of a Gartley. So with that in mind, you already have strong signals favoring a reversal/change in trend.
Of course this tactic will give you only a few opportunities o trade, because not every gartley has a visible Ew structure, and not every visible Ew structure has a perfect fibs confluence, but sure it’s one more tool you can use to give you an edge.
I don’t want to distract the main purpose and techniques of the thread, and since TMoneyBags is still around, it’s up to him if he choices to change the strategy or give new insights, but I also think it’s up to everyone to try new tools mix them up to get better results.
Thanks for the respons Wrtm, always intresting to hear your thoughts and advices
What i try to do my self is to use 2 or more Xs and find convergence at pivot points, prices often bounce becouse of the strong resistance Any one other have a diffrent approch?
Hi All - Just wondering what happened to TMoneyBags - does anyone know? It seems he hasn’t posted in weeks. I’ve been following his thread for awhile now and have been reading the book he recommended, Trade What You See - excellent recommendation btw. A little tip for anyone who is interested - just saw it as an e-book on ebay for 99 cents (auction ending in 3 days) - that’s a steal!
Anyways, I’ve learned so much since I’ve stumbled upon babypips.com and will continue to learn each and every day thanks to all the wonderful posters who share what they know, so glad to be here! I wish you all great success in your trading!
I’ve been wondering the same thing! Hope he didn’t try to hold on to the Daily EUR/USD Butterfly too long… it’s been brutal watching that continue to plummet! :eek:
I am not a fan of e-wave but i still do understand its basics. anybody that have been reading wrtm_19 article will get his idea of picking harmonic patterns at the end of wave 5 which signal reversal. this is a smart way to increase the probability of the trades.
My experience in trading proves that trading based on convergence(more stated and guided technical reasons) alwayz increases the chances of winning a trade.
with this been said. lets look at euro daily TF.
price is a bearish channel, with wave counting from 1-4 and presently we are in wave 5. which shd mark the begining of corrective wave after its completion. interestingly, we have bullish gartley 1.2965-1.3000, which i believe shd mark the end of the 5th wave as wave 5 in an idea situation shdould not be longer than wave3.
I am of the opininion that price we get to that level before blowing north for a large correction.
looking at that 1.2975 level, it should be noted that its a strong support zone that most likely reject price. putting all these together we should see a rally to 1.4000.
Am not in the bizness of predicting price movement but i have seen this happening more than 1000th times in my trading career and i believe that its chance of success is very high.
yet, there is still way to trade this to avoid whipsaw due to market trap. this requires some skills. i could have given link to my site to see how i trade these pattern with what i call trend analysis theorem(not e-wave). u can PM me to give u the link.(BP, hope am not violating any rule)
though price is still far ahead but good to plan ahead.
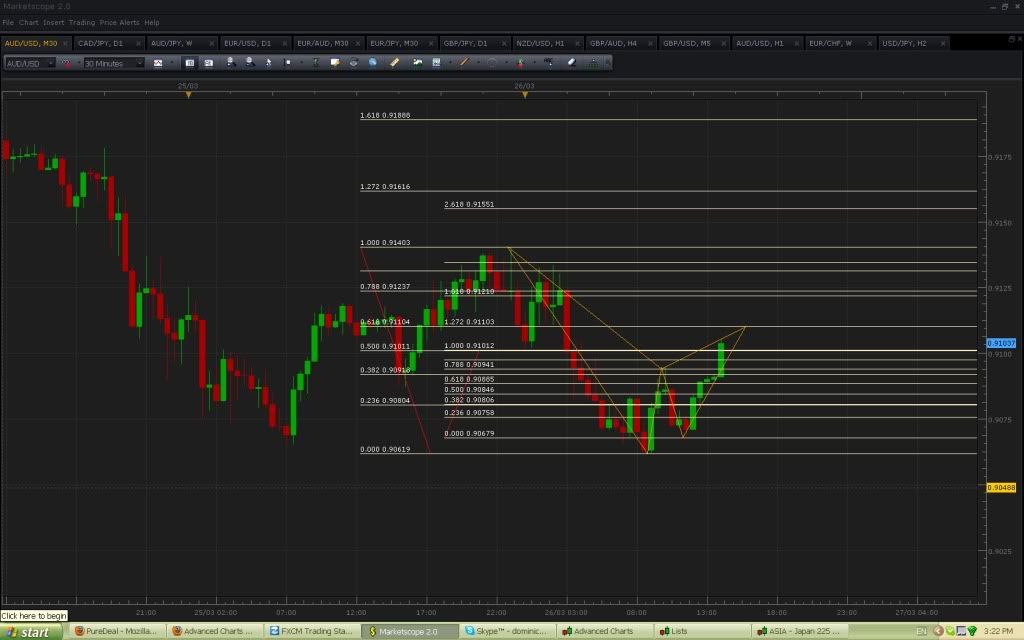
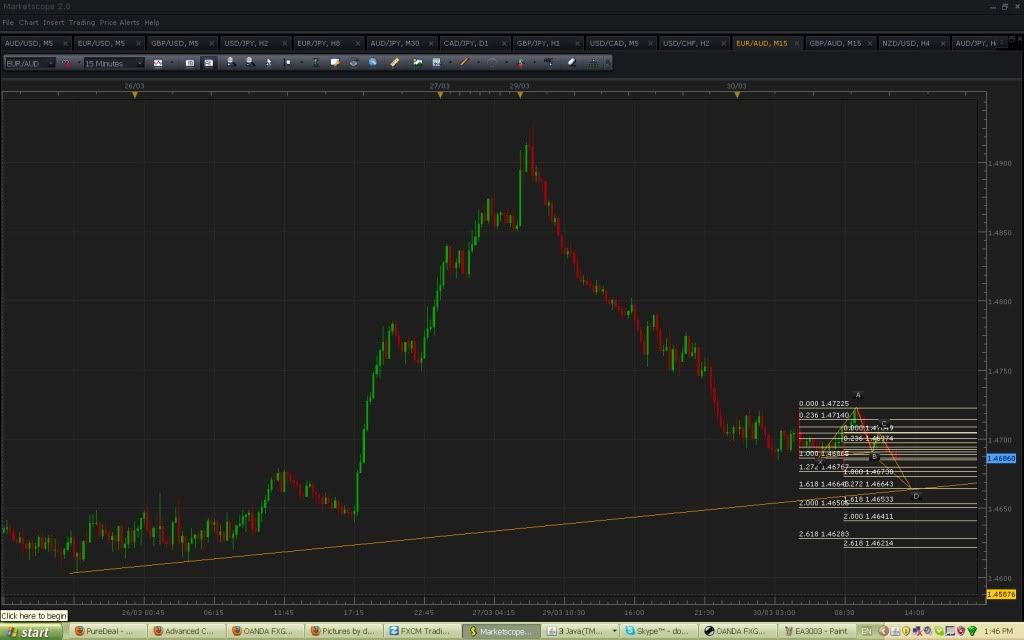
Sorry about the short timeframe, but i’m just playing around on demo and noticed this on the eur/aud. I guess it’s off topic, but i’m trying to develop a way to trade the final thrust of the CD leg on butterflies. My aim is to hop on board when the losers are liqidating.
If a butterfly has been identified my plan is to sell a break of B with stop above C. Target would be the 1.272, or D for the more agressive. Reasonable RR in this instance. Would also look to get long with a buy limit at D.
It just strikes me that there are times when you have a limit at D and once B is broken you are fairly confident price will break X and blow thrugh to your entry. So why not try to make some pips into as well as out of D. Maybe this is just greedy and deluded.
If anyone has any experience or thoughts on this approach I’d be all ears. And if this discussion is beyond the scope of this thread please let me know and i’ll take it elsewhere.
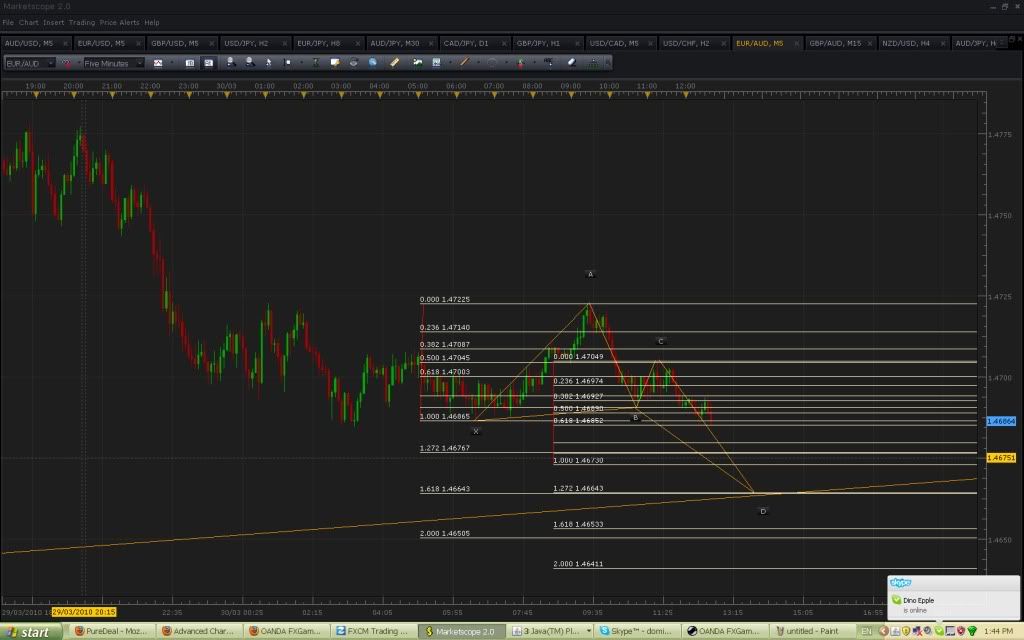
Well, price just broke C, so the butterfly is now invalid. (if it ever was valid)
Mixed result. Price reached target 1.272 XA but the RR was less than 1:1, so not ideal. I guess you would need short BC legs (not uncommon to butterlies) to make this approach worthwhile. Or perhaps you could scale out with t1 at 1.272, then breakeven stop on balance with t2 at 1.618.
Anyway, this really is off topic, so i’ll leave it alone now.
I’m pretty sure that some of you are tracking the major bulish gartley for EUR/USD under weekly chart. Found a bullish butterfly for 15min that seem to align with the major pattern.
A little late, but I think it’s still good.
Click on the thumbnail image, which will lead you to a page. Click on the image again to see the enlarged versions of the charts.
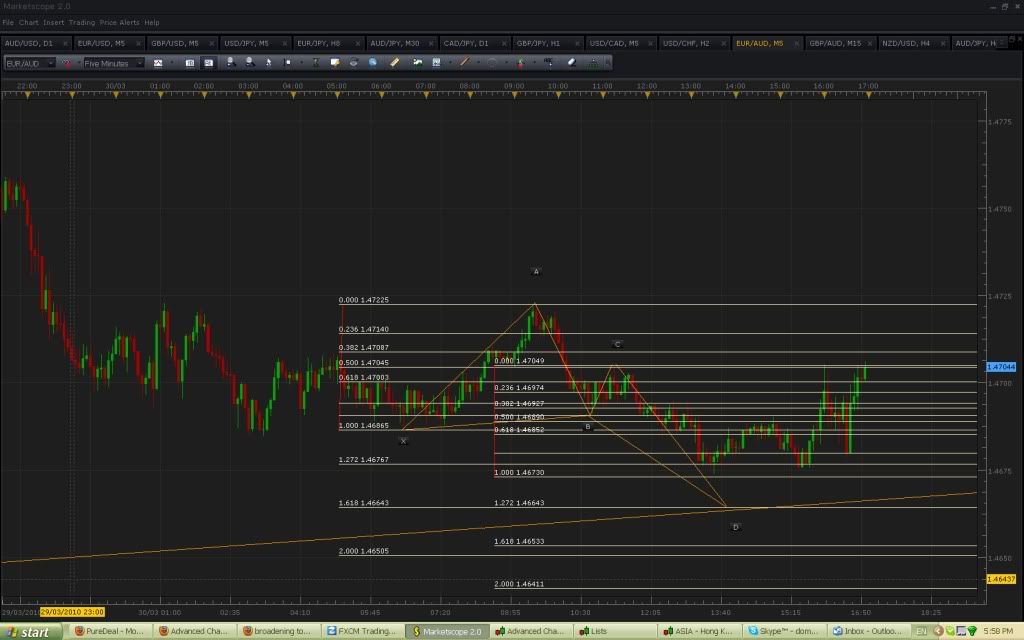
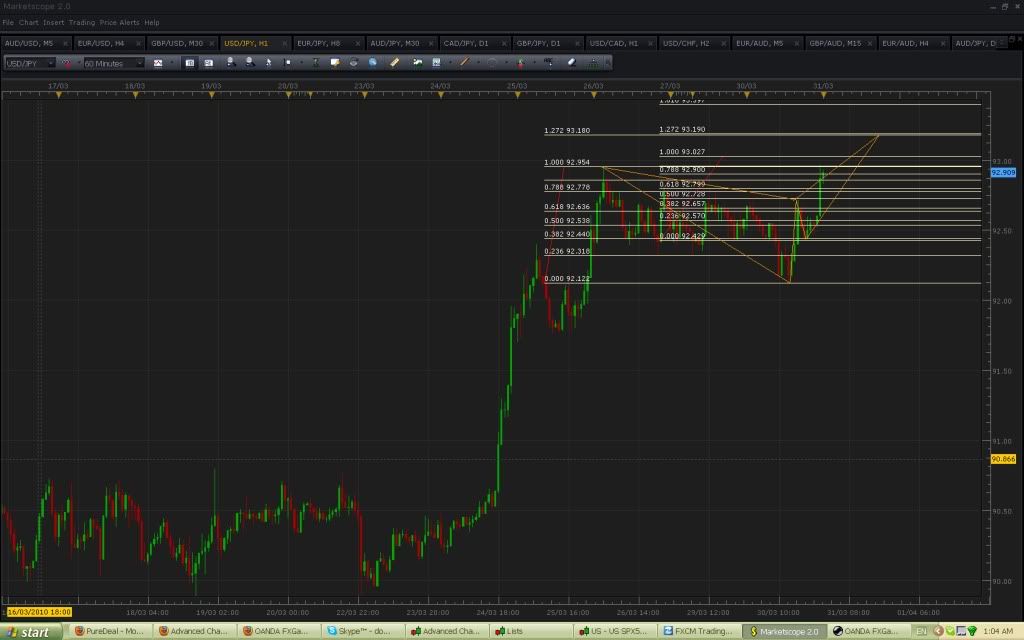
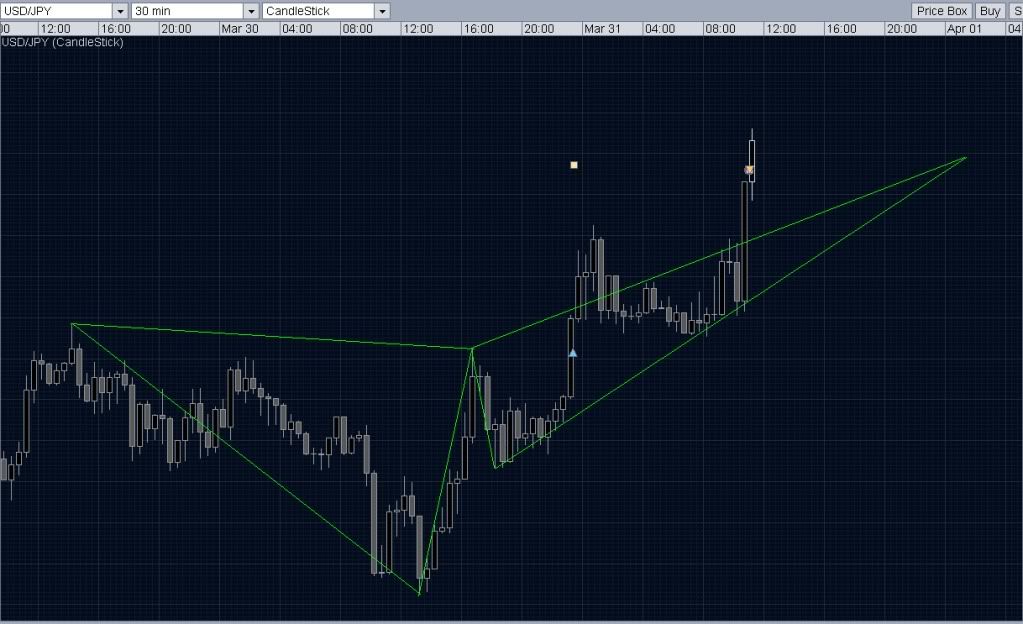
You beauty, the CD leg trade worked. Bought a break of B where the blue arrow is on the chart. exited just prior to D. 45 pip gain, never moved out of the money, RR > 1:1
Reversed position at D (well, a few pips early to be sure to get set.), so now lets see if there is anything to this bearish butterfly. The good thing is if you earn pips into D at least it offsets your stop if the pattern fails.
Bear in mind, this is only on demo, but I am still encouraged by this trade.
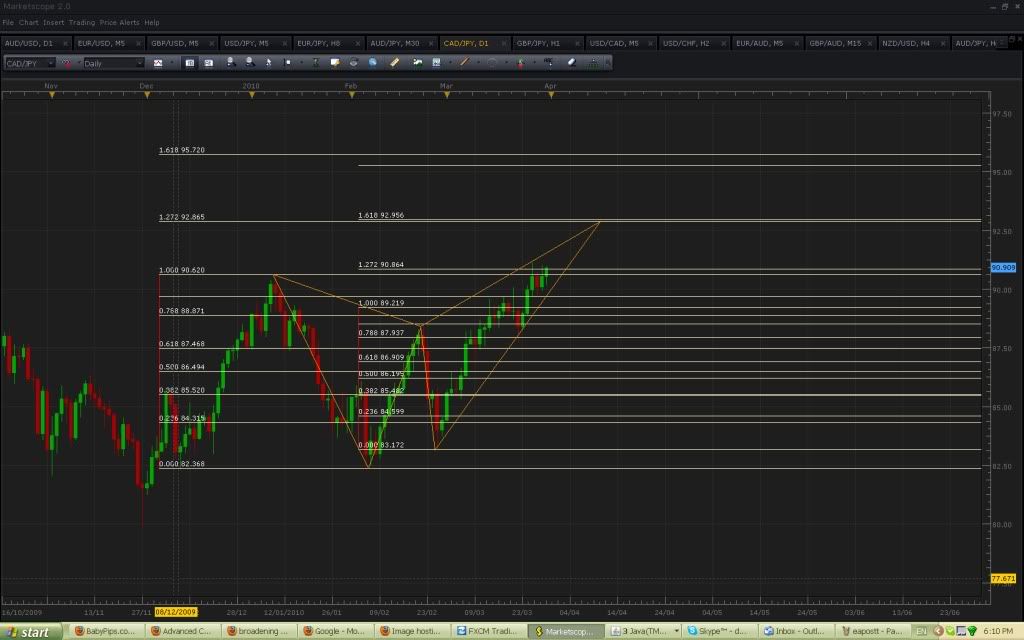
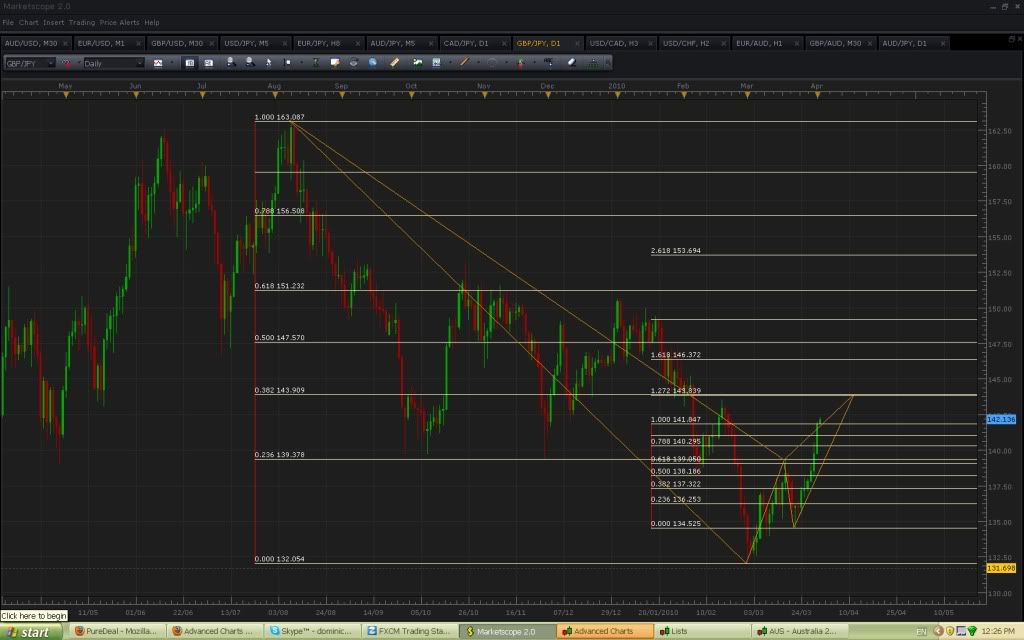
I took the bearish butterfly trade on the USD/JPY posted earlier, unfortunately it shot past the D and I ended up managing to stop out with only a 6 pip loss.
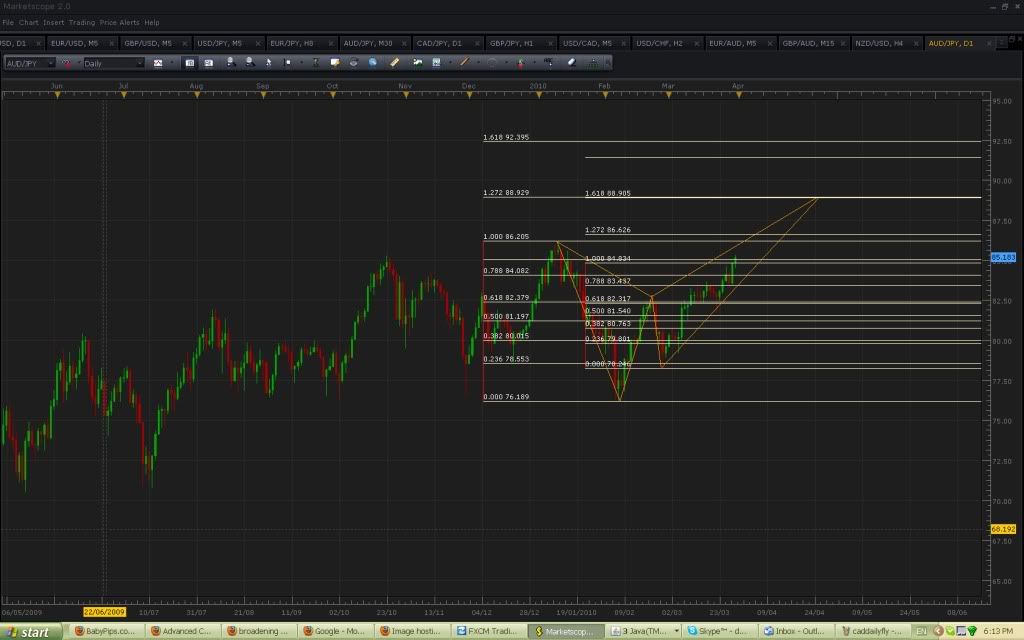
Then I went to the 8hr time frame and noticed that there is a major upcoming sell gartley forming which may be where the true D lies.
I don’t get convergence there as I see 50.0XA as 127.00,but that’s not to say your pattern wont work, maybe I am doing something wrong with my fibs. I agree with the ab=cd and it has good symmetry. Price has pulled up at your D almost to the pip so you really could be onto something there.
Only other concern I would have is the break of neckline on possible inverse head and shoulders on the 8h.


 I wish you all great success in your trading!