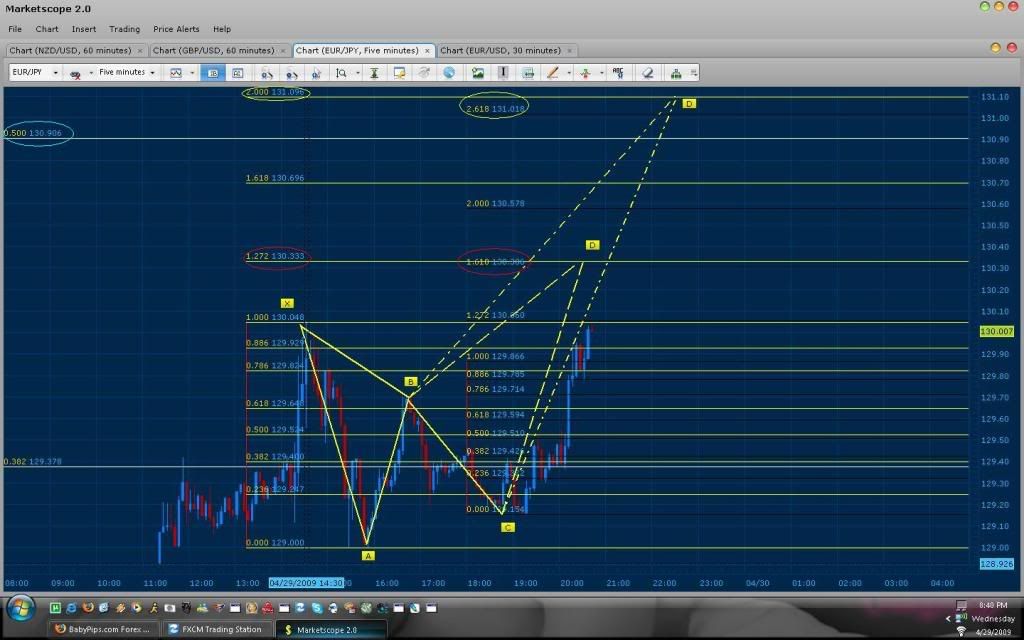
What do you guys think about this pattern? Convergence is at 2.00 CD .886 XA. Hope it works!!!
Good trading!
What do you guys think about this pattern? Convergence is at 2.00 CD .886 XA. Hope it works!!!
Good trading!
And what about this one on the 15min chart usd/jpy. Sometimes I feel like I’m forcing things to happen, forcing patterns to appear!
Ogna,
I took that same trade and lost a few pips on it. However, losses are bound to happen and we can’t measure the validity of the system on the first couple trades. Just make sure you trade small enough to be able to withstand a string of losses. I’ve traded valid systems that lost 5 or more times in a row even if they were profitable in the long run.
Still, even in a strong uptrend, it was nice to see price stall at our convergence point. It definitely shows that these levels are very significant.
Hey WRTM,
It sold off for 40 pips from 1.4728…I did not take the sell and 1.4740. I sold again at 1.4790 but I set a 50 pip TP and went to bed so when I woke up I saw it had taken me into 39 pips profit and pulled back almost to my breakeven.
So all in all in worked out well today.
Bank
Well It didn’t work. Price went up like there was no tomorrow
Yes that was a freakishly large move for that pair in that short of time…:eek:
There’s not much happening for patterns right now …so no, don’t force them.
Why go there when we have one right here at babypips …Forex Calendar: Economic Calendar for FX Trading News & Event Risk 
…but ya, shoulda known. I have that calendar right on my charts, but I’m not at home and have gotten kinda spoiled with it…lol
Thanks 
Does anyone see anything ? LoL today I cant see a thing :\
Nope, can’t see them either…oh well, time to do some of those “other” things we’ve put off doing…
Hello,
Here goes a possible setup on EUR/USD & GBP/USD 15Min. Please share your thoughts.
Thanks!
Bank
EUR

GBP
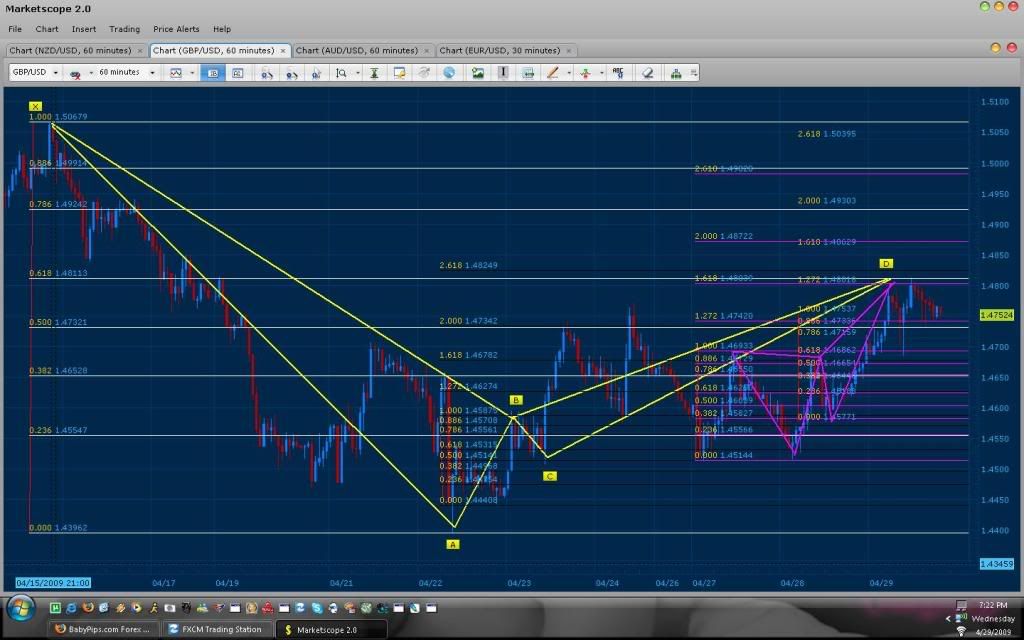
As stated earlier today, the majority of the markets did not have any symmetry at all. The only market that I found to be flowing with the symmetry of patterns that we all should be looking for, was the GBP/USD. This was the pair that we all should have been looking at. Especially since I had posted 4+ patterns confirming major resistance in the areas it was reaching. As seen Bellow:
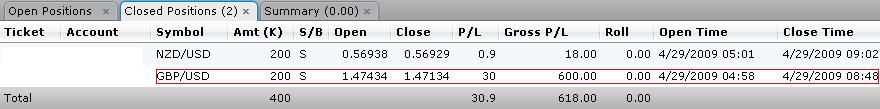
Here are the results:
Notice how Price respected the .618 of daily by price “nipping” with the wick and starting a new down trend at the next open (Bounce at 11:30 am EST). The move was an estimated 30 pip move. More then enough to get us double the 30 pips needed for the day. In addition, take note that I was even able to make money off the original fake out D during the news release this morning as shown bellow:
In addition as stated on earlier posts on the thread, when price is not making any sense draw your Fibs from the “Base price” of X to the Wick of A (instead of wick to wick). This will then show you convergence and patterns that you may not be seeing do to the fact that price is bouncing off different fibs as shown bellow:
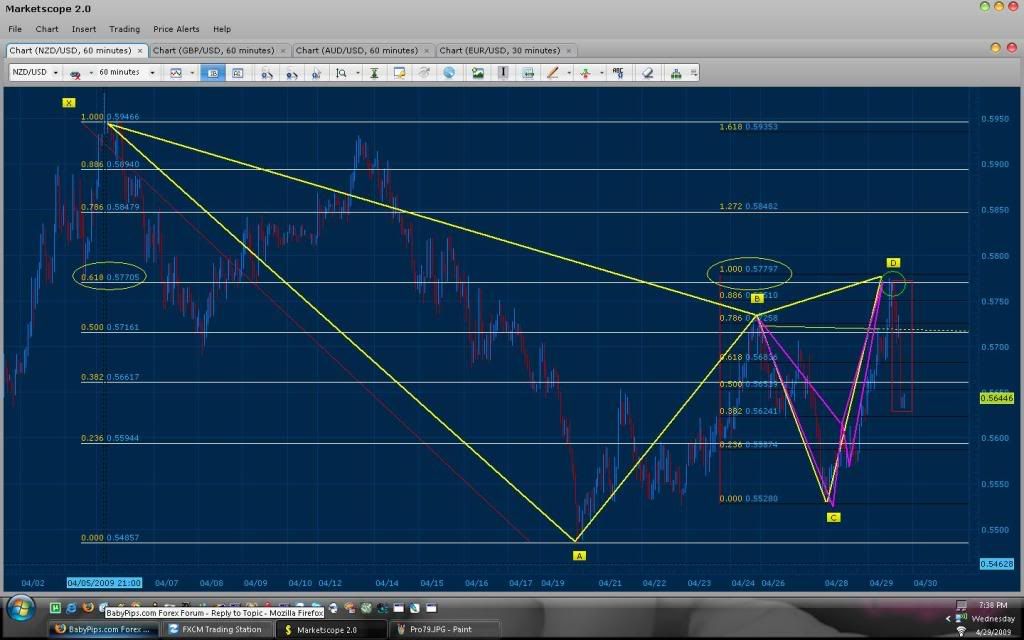
Here we have not Only a MAJOR 240/60 min pattern for the kiwi (Bearish Gartley) but also, a nice Bearish Butterfly on the 60/30 min. The NZD/USD had great convergence at the XA of the major pattern converging with 100% of CD. The Butterfly also had great convergence at 200% of CD and the 1.272 of XA (Pink pattern). This pattern gave us 4 Hourly bars to get in before its major retracement from 11AM - 2PM! Congratulations to any one who saw this and I’m sorry for not posting this pattern during that time (I had only 2 hours of sleep and was very tired). Anyways, here are the patterns bellow.
By 5pm est Price retraced 50% for both patterns! Again, it is incredible how powerful these patterns are.
Look out for resistance on the EURO/JPY during the end of Asian market and possibly throughout the London session.
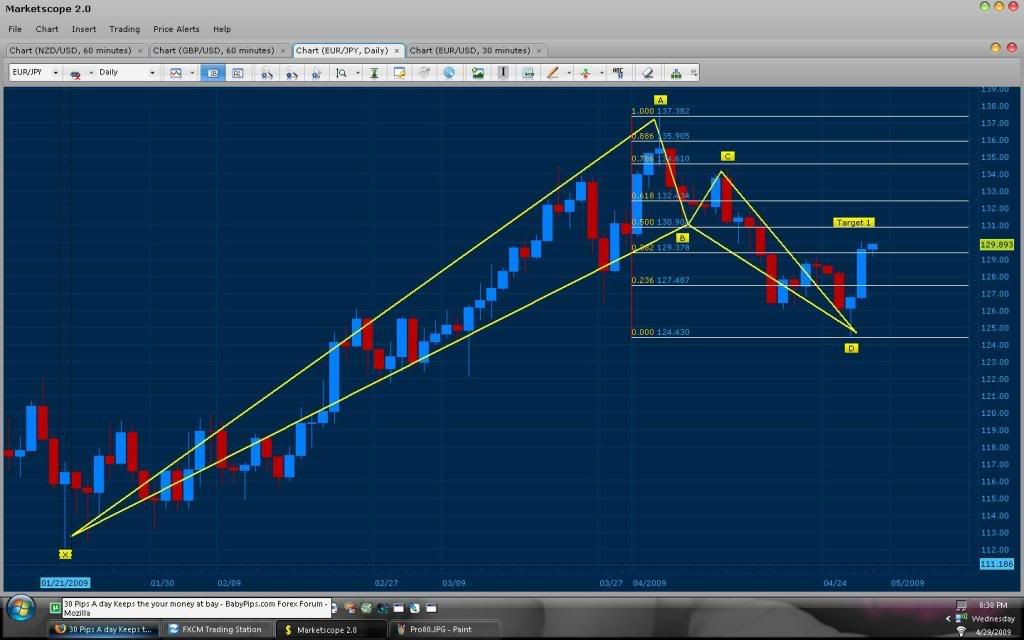
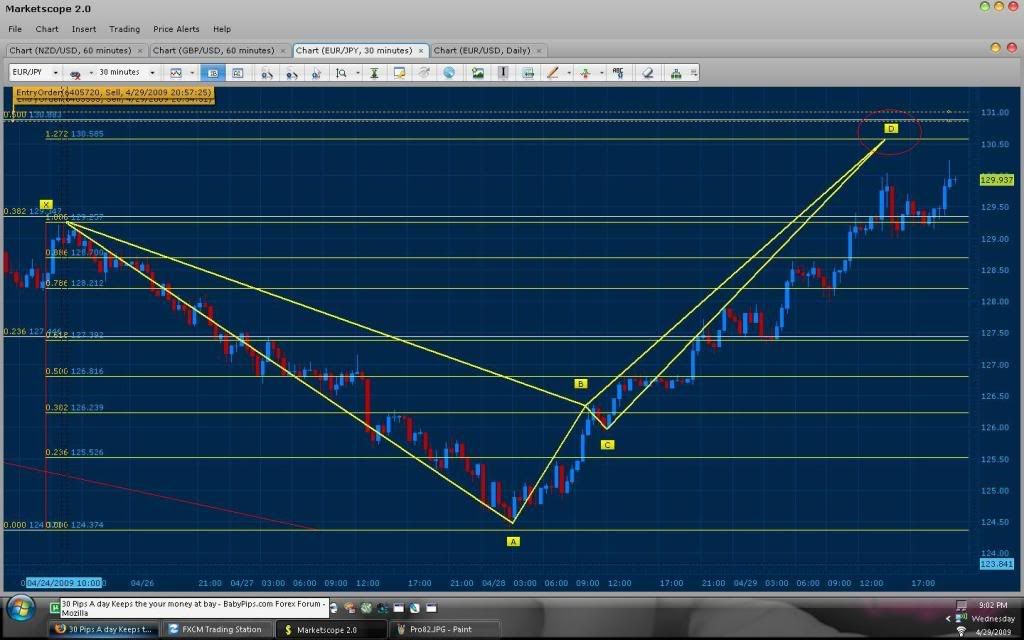
The EURO/JPY pattern predicted earlier this week is reaching its First target (remember the daily trend is down so this move can be major).
The original pattern prediction can be seen here:
EURO/JPY reaching .500 fib of XA (Target 1):
At first when looking at the chart from a high time frame, we see no symmetry at all to trade the bounce. But when we “zoom in” and look at the pair through the 5 min. We actually have 2 patterns that are about to be reached, one of them should be reaching it by 9pm est. Bellow you will notice that 161% of CD converges with the 1.272 of XA (Bearish Butterfly). In addition, there is further convergence above the .500 Daily fib level where 261% of CD converges with 2.000 of XA. I expect price to either bounce off the .500 XA daily as soon as it touches it or spike through, hit the convergence from the 5 min pattern and close bellow the .500 to continue its retracement.
Furthermore when analyzing the 60/30 min charts, even though price obviously has no symmetry we can see a possible Bearish Butterfly pattern developing at the 1.272 of XA. The fact that XA of this pattern is near the vicinity of the Daily XA .500 and the 5 minute pattern in addition to the obvious exhaustion of buyers (no retracement greater than 23%), we have reason to believe that this area will be a turn around point in price. Which is why I will be placing my sell entry on the .500 of the Daily. See Bellow:
Wow that eur/usd pattern worked really well! Wish I had seen it before
Cheers!
Si quieres explicalo en espa�ol :rolleyes:
Just like you said tmb, these patterns completed at the start of the Asian session…just when I get home from work…too late to enter them now. So now I just wait for new patterns to setup which will take a few hours. However, I’m watching the 1m t/f for some possible quick scalp setups…lol…will report how it goes…
Lol well, my mentor has a friend in NY that scalps that way heh. Would be interesting to see your results. I have seen some nice patterns on the 1 minute develop into good bars lol.
Hey everyone!
How does this pattern look to you guys?
Somehow it seems a little iffy for me I cant figure out what it is maybe B went too high? I dunno that’s why I posted hehe
(5 min chart)
Hey Ogna, that’s similar to a chart I just drew up. I didn’t take this trade due to a lack of confidence in it, and my convergence point wasn’t as spot-on as I would have liked, but price still made a nice 10 pip bounce so far where I placed my D.
Here’s a 1m chart of usdjpy of a bullish gartley I’m in for a long… at 97.51, t/p for 10 pips.
I also got psyched out just a little earlier cause it didn’t seem like it wanted to go down to the 161.8% line (where I had a pending order sitting), and since it was only like 5 pips away I entered there too, so I actually have 2 positions open…