Hey,
just an off topic tip for everyone, DO NOT USE FX SOLUTIONS
I love the charting system but omfg their customer service is so rude… I used the customer service 7 times at different times and every time they were rude and incompetent they couldn’t answer my questions! They were so rude dont even use them but now I dont have a broker…
What do you use TmB?
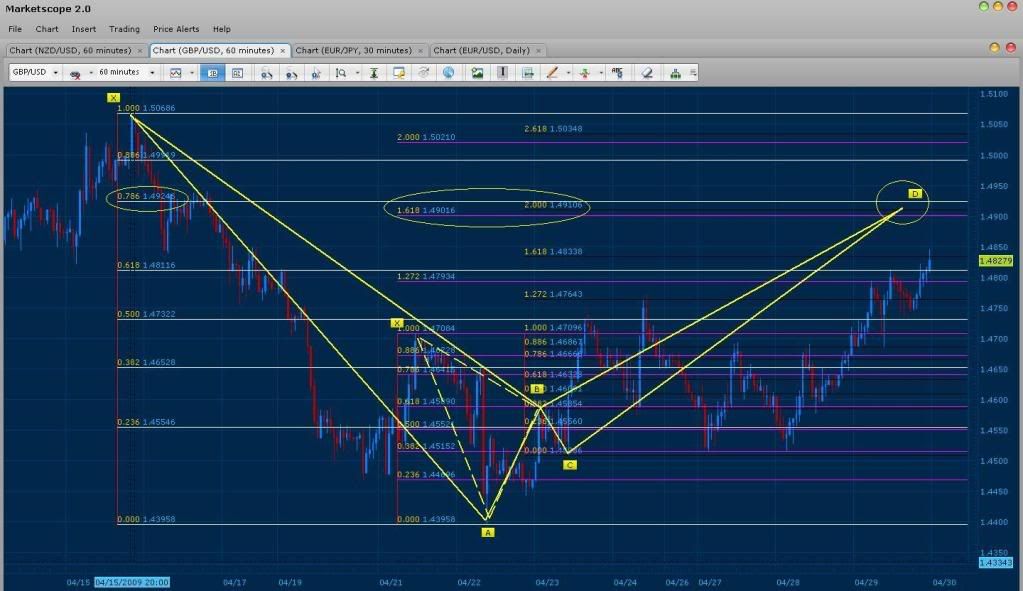
Looks like price for the GBP/USD is moving up and it spossible that it continues to break the .618 of the daily to reach the .786. Bellow are some patterns that may find the true retracement for the pair if it does not respect its current zone.
Here we have a Bearish Gartley where 200% of CD converges with the .786 of XA. In addition, within the Gartley their is a Bearish Butterfly when we place X at a lower extreme. The 1.618 of the Butterfly’s XA converges with the same 200% CD used for the previous pattern. Signaling resistance in the circled area. I will be placing a sell entry directly on the 200% of CD. It is possible though that price consolidates or completely retraces from the area it is at right now.
FXCM. Great customer service, even on their mini and micro accounts. Fast response as well. They also have good tech support for Marketscope 2.0.
Cool I will check them out
Is marketscope like their charting system ?
and would it work if i used the fx solution charts for a FXCM platfom?
UPDATE:
Failed :(…actually I was up +5 and b/e…should have took that, but the pattern “looked” really good …sigh, but anything can happen.
Hi TmB. I try to draw the same pattern that you have on the gbp/usd, but I can’t get the same results. Can you help me figure out where am I wrong? My convergence appears at the 168% CD 100% XA. I just can’t figure out why am I getting these results!.
Regards!

Hi Ogna, the reason your not seeing the same convergence is because my BC started at 4/23 1am - 4/23 10am.
Thank you for showing me your pattern though, even though your BC is incorrect, when you draw it correctly you see perfect convergence with the 127% of CD with the .886 of XA giving us a clean symmetrical trade. Thank you very much  This could be the Real D the pound is trying to reach. In addition, 100% of this CD is near the area where I had my original pattern drawn. As a result, it is possible to take on both trades for 30 pips. See bellow:
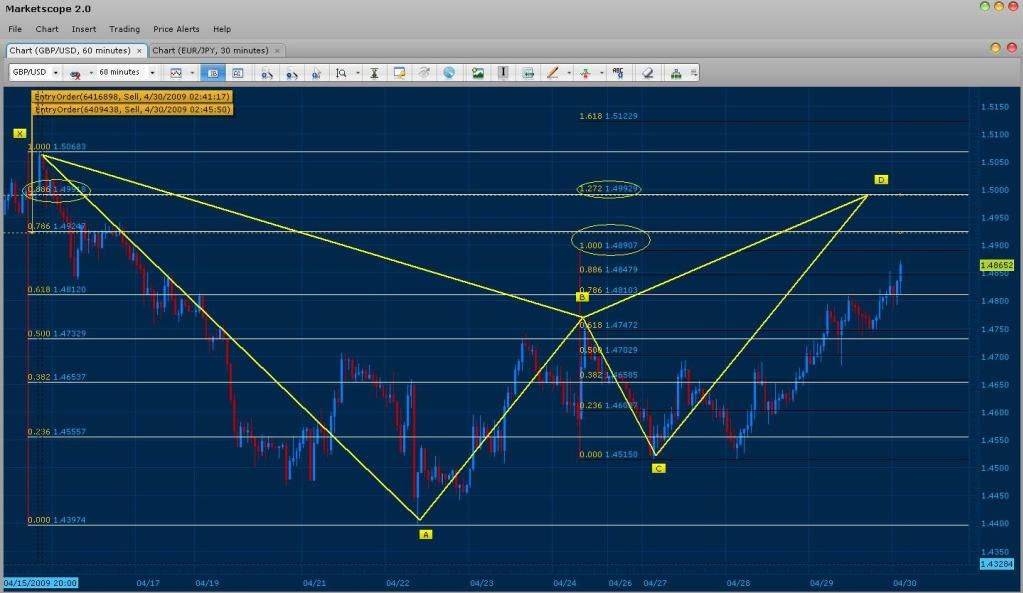
Again, This pattern has great convergence with the .886 of XA and the 127% of CD.
-Edit-
Our first entry at the .786 of XA Failed (Price closed above the .786 on the 60/30min charts). Leaving us with a minimal loss of -2 pips. As a result, our “true D” should be at the .886 of XA where our good convergence is at.
Looks like the Fake out D actually came through as predicted and would have given us our 30 pips. Even though we closed at -2 and missed this opportunity I’m glad we avoided the risk (An hourly close above a Daily fib level is significant and could have turn this trade very sour) But, I am also glad to see that we predicted this fake out move and that it would have reached our goal. Do not be fooled though, this pair still has a very good chance of triggering our entry at the .886 of XA and completing the bigger pattern. Be on the look out for the move upwards.
Good Morning All!
It is so funny that Ogna does not recommend FXsol and TMB recommends FXCM. I had a reverse of advice just yesterday and am looking to switch to FXSol. I dont like the fact that there is no online or phone support for Micro accounts with FXCM. I suppose you just have to weigh the information and choose based on what you are looking for.
Good Morning TMB,
Does price have to converge to the pip for the setup to be valid? What if it is off by 1 or 2 pips? I had two such experiences yesterday evening with the EUR/US AND GBP/US. Both were fake outs, but still gave the 30 pips. Please advise.
Thanks!
Bank
I’d say a 5 pip range is good convergence and any thing between 0-3 is great convergence based on a 30 min pattern.
Ok Thanks TMB!
Our EUR/JPY Bearish Butterfly trade has just triggered. As predicted, the pair has hit the daily .500 and moved violently. In effect, reaching our 30 pip goal within a mater of minutes (1-5 mins). As a result, we have decided to move our entry to a 60 pip gain for the day. In addition, we have added an additional entry at the .500 of the daily for if the for if price decides to retest the level (possibly making a double top) before shooting towards its first target (50% retracement of AD). If price does retest and trigger our new entry, we will move our limit from 60 to 30 for each. In the end reaping the same reward for such an occasion…
Here is our original prediction:
The trade is bellow:
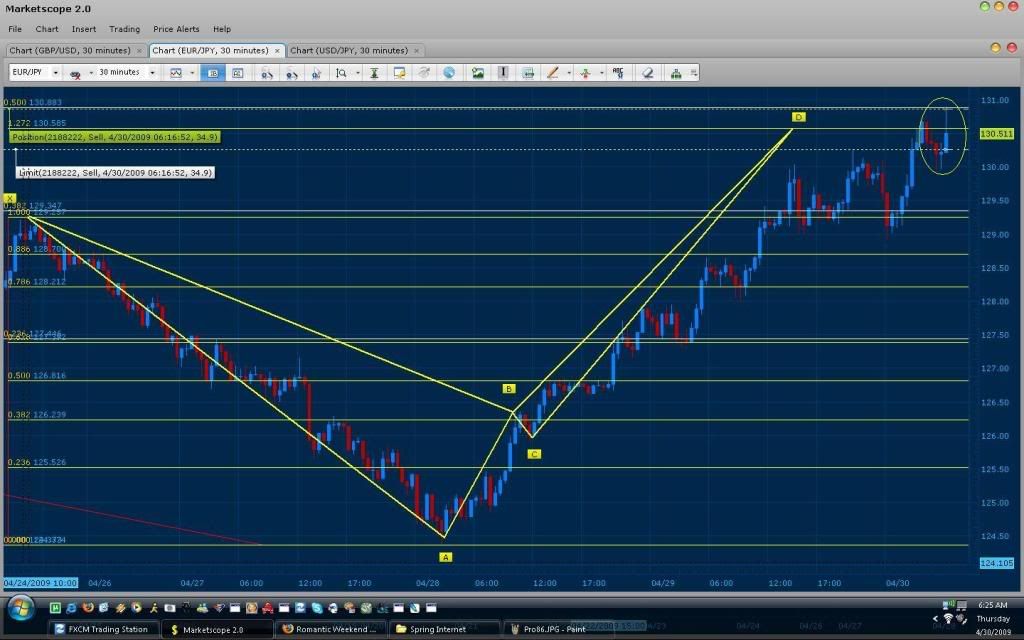
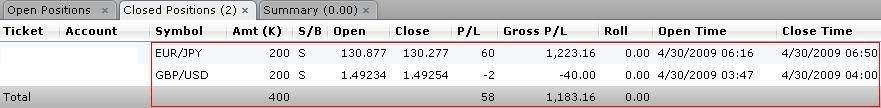
Our prediction and calculation paid off… and very well indeed. Our limit of 60 pips has been reached, leaving us with a total of 58 pips for the day. Price reaction at this level is sufficient confirmation for the pairs reversal, especially when we take into account that their should be significant price exhaustion within the buyers of the pair. Congratulations to any one who traded this pair. I have to admit, I was running out of patience waiting for our entries to hit lol (good thing I decided to take a nap). Bellow are our results, and I will be posting this months report shortly. We will not be trading for the rest of the day. Good Morning bank :rolleyes: and every one else online.
Good Morning TMB,
This is a great way to start the morning…very inspiring!!! Good Trade!
Fx is honestly horrible lol
try their customer support
Still focusing on finals but I was looking over an EU chart 4H chart on Metatrader and things looked interesting to me. I started to attempt to apply some of the concepts I have been learning here to what I was seeing. I am going to do a step by step for my benefit and maybe even for some other peoples benefit.
[B]Step 1:[/B]
Looking at the chart it looks like I am looking at an ABCD patter to the far right. So I ask myself if there has been any way to apply the concepts in this thread to guesstimate D. I recall in one of the initial posts that it is generally better to draw XA leg so that X is one of the extreme points on the chart. So here is what I get:

Note that I see all kinds of little patters inside of this XA leg but I am focusing on the most recent moves
[B]Step 2:[/B]
So we have our XA set of fibs. Now for the AB. I recall (will post link to post later) that the first leg after XA is generally best to use for AB. So using this concept we see that the first leg goes to approximately the 50% Fib line. Great! So now lets draw a set of fibs from [B][I]A to B[/I][/B] so that we can verify our point C.

Price retraces right to .764 fib line (shouldn’t this be 78.6?) but doesn’t close on the lower side of it. If price closed lower than this Fib it MIGHT show that there is a reversal in process and we could see price keep moving that way. Ideally we want price between .50 Fib, .618 seems to be most commonly hit Fib, and the .764 fib still makes the setup valid. Now we have XABC points so we should be able to look into the future and get a good idea as to where D is going to fall.
[B]Step 3[/B]
Erase the previously drawn Fib line from A to B and now draw it from B to A like so:

Now we are going to drag this whole Fib so that the 0.00 Fib line matches up exactly with our C point:

[B]Step 4:[/B]
Seek the convergence! We are looking where fibs from the XA leg line up with our extra set of Fibs. Look at the circled examples below:

Fortunately for us we know that D must go beyond B to be a valid pattern. So we can cancel out the lower circled convergence for it is below B. Well that only leaves us with one convergence… could it be… is it possible? Well technically only time will tell BUT lets look at a few things:
1.) This is a 60 minute chart - movement to that point would take a long time and there is the possibility in change of sentiment based on news and other items.
2.)Perfect AB = CD then a reversal. For me this means that while the above example might be still possible I might want to try to see if I can generate other patterns.
3.) This is for educational purposes only and I could be completely off base here. Do not attempt to trade this unless you have done your due diligence 
Look at this:

This is drawn from the week start. A 100% convergence is a strong indicator from what I have read from different sources.
All of this is open to criticism and comments in hope we can all learn more.
Thanks Ogna…I will see what happens. I had an account with them when I just started out and understood very little about brokers and so forth. But had good support. Will see…
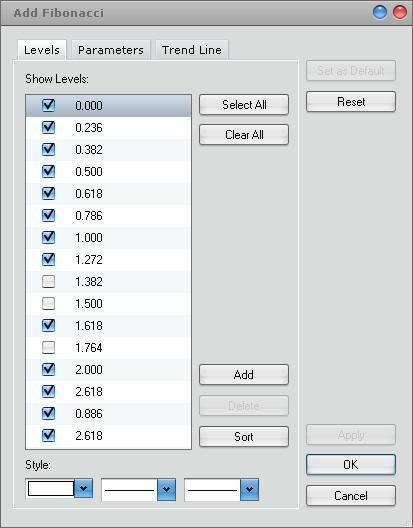
Nice tutorial on how to draw and setup your fibs for finding the patterns Sniper, Good job. I suggest though that you replace your .764 fib and in addition, use the fib list bellow (these are the major fib points required to trade these patterns correctly). Also, note that the pair you selected has been pretty unsymmetrical this month so it may lack convergence in some time frames or from certain extremes of X. Again great tutorial though, this should help a lot of those who are confused with the system.