Im not sure if the above has been posted before by TMB but i saved it as a PDF for myself to refer to … thought i might aswell post it up here for you guys to download … hope TMB doesnt mind …
Trading Checklist.pdf (10.3 KB)
Im not sure if the above has been posted before by TMB but i saved it as a PDF for myself to refer to … thought i might aswell post it up here for you guys to download … hope TMB doesnt mind …
Trading Checklist.pdf (10.3 KB)
Upcoming Bullish Gartley/Butterfly (X same level as D) in EUR/JPY 30min.
Not the best of convergences (4 pips difference) but we should keep a look out.

TMB, its great to hear from you as always.
I have noticed a long time ago you have an eye for these patterns in a way most people dont, I have tried to see themas you do by going over the older posts. I was wondering if you could post up a few charts of some nice patterns you trade the next few days or something so I could try to see what you see.
Also, Have you started taking smaller timeframe trades? With long term ones you go for more than 30 pips I imagine?
Okay I’m done bombarding you with questions/requests
Cheers
I use an emulator/virtual machine (parallels) and I have windows installed in my mac just like any other program, not like the main OS, and it runs really fast. And you can switch programs just as you normally do it in your mac.
For what I understand you’re using windows as your main OS right?
As stated in the past, I use the smaller time frames to get me into the “wick” of price. In other words, I would use the 5/15 min chart and see if their is some sort of higher convergence above my 30/60 min pattern. In addition, I also use these time frames as hints to whether or not the trade will fake out (for the most part when you get a 15 min close above a 30 min convergence, a fake out will occur hinting at a higher convergence point (This happened with the USD/CHF earlier this morning). As for long term trades, I am using minimal lots (1-2 lots for accounts between 20-50k).
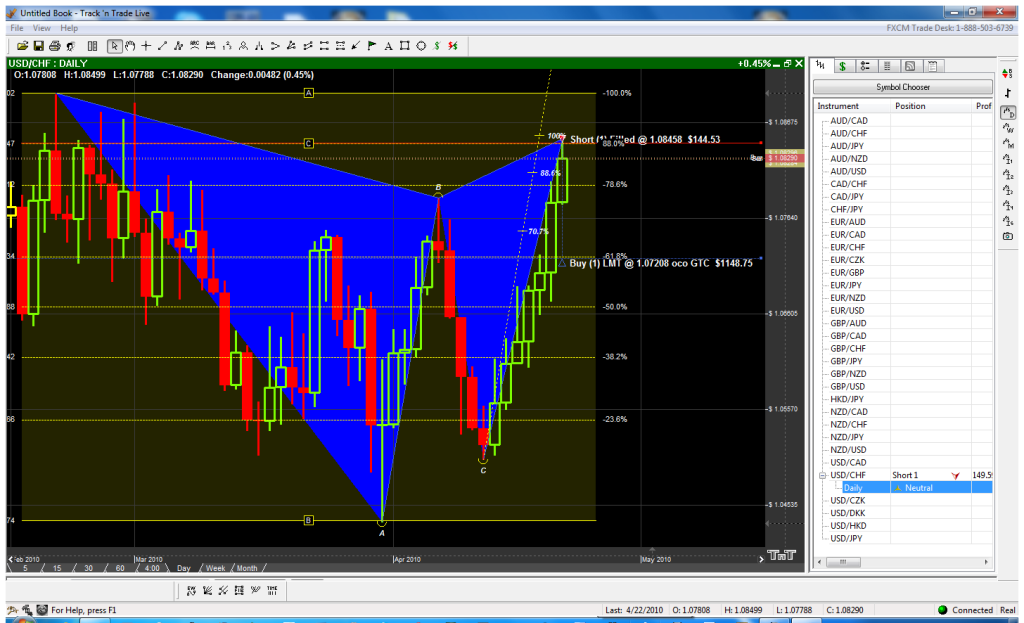
Bellow is a Daily pattern that has triggered on the USD/CHF. I am taking this to the .382 of the CD leg as my take profit zone.
when u use smaller timeframe to get into the “wick” of price, what form of analysis do u use? Do you wait for another gartley pattern to occur before you decide to go long/short on that currency pair?
No, i just use windows for metatrader, Ive installed windows purely for forex charts and its such a hassle, i might have to end up using an emulator when i get trading more frequently.
Yeah I know! Such a hassle. When you decide to install your emulator there’s one for free that you can download from the internet, I don’t remember the name, but you can google it.
I suggest you to do so because if I had known about it before I’d never installed parallels. Don’t get me wrong, it works really good, but this other free emulator works amazingly good too and it’s free, so you don’t have to worry about the updates.
The $ was the only thing stopping me, i didnt think there would be a free one, thats great ill get onto it - thanks Wrtm! How have you been going with your patterns? i have been reading your posts since around december/january, and its always a good sign when youre still posting in the thread 
You’re welcome. Virtualbox is the name of the emulator!.
I’ve been doing great thanks for asking. I’ve added some other characteristics to my patterns and that’s the main reason why I don’t post here often anymore. But sure I keep reading it and this is my main way of trading.
When you find a pattern on the 60/30 min, your C-D Leg usually turns into a 15/5 min pattern. When the convergence of this is let say… 5-10 pips higher then your 60/30 min convergence, you can expect price to spike up and touch that convergence and create a wick starting in the lower time frame. Remember the basics, all trends start from the 5 min chart. This is also true when taking long term pattern trades on the daily-4 hour charts (use the 60/30 min to see if patterns develop near their convergence areas). As a result, when you find a pattern, always check if their is a smaller pattern adding to the convergence point you have found. In effect the more convergences you have at a given point from different time frames, the stronger the pattern should be. All in all use this method to find the best currency to trade for the day, you might find a great bullish pattern on the EUR/USD and on the GBP/USD but the GBP/USD might have multiple convergence points which you missed out on if you did not fully analyze the lower time frames.
*Note: Such an analysis prevents typically prevents you from being fakes out, especially when you have multiple converging fib levels on the 30/60 min pattern.
I.E. The 30 min Eur/Usd can have convergence at the .382, .500, .618, and the .786. Even though the .618 is the favored fib level to take, the .786 may have patterns from the higher and lower time frames developing at this zone. In effect, hinting that the other convergences on your patterns may be fake outs and the .786 is the ‘true’ D point.
You can refer to my earlier posts for more information.
The EUR/GBP 4H trade I posted earlier has taken place and the price has acted:

However I missed my entry point by a few pips! I am trading a demo account anyway so it doesn’t matter that much, I think it matters more that I was able to predict the price movement.
Sorry for the off topic, but can someone please help me figure out how to view this thread in order of Page 1 onwards? i.e. Page 1 being the first page of the thread with postings going downwards, instead of having to go to the last page and scroll upwards to read in order.
Thanks,
NeoRio
nice to see you back tmoney !
Great stuff mate, well done.
Hello guys, im here with my discipline (weak) but going strong, so i am my first trade following all the rules by TMB, so lets begin:
I found Butterfly pattern on H1 of EUR/CAD (see attachment), and there is the first group of rules lets see if the trade meets them:
THERE IS NO NEED TO ALWAYS BE IN A TRADE.
a. Make sure the market you are trading is flowing in a symmetrical manner.
Ok thats what exactly means? I have uploaded a H1 image of the pair. TMB what exactly are we looking for on this?
b. Choose the best convergence point when selecting a ‘D’.
Thats Done 
c. Only trade the 30/60 min charts (use other timeframes for market direction
‘clarity’).
Same
d. You only need one trade to reach 30 pips in the market.
ok
e. NEVER ADD TO A NEGATIVE TRADE, CLOSE YOUR TRADES WHEN
THEY FAIL.
ok
Always set a stop loss point, whether it is visual or physical, a failure point must be set.
a. Before a trade reaches 10+ pips positive, set a visual stop bellow your fib entry
level for a bullish trade and vice versa on a bearish trade.
i. The visual stop of a trade must be a close bellow/above the respective fib
level in which convergence was found. The close of price is determined by
the time frame the pattern was found.
ii. If a physical stop is placed, make sure that it is bellow the following fib
level. In addition, the above rule ‘i.’ must also be followed.
b. Once your trade reaches a 10+ pips positive set a physical break even stop .1-5
+pips above/bellow your entry. If the stop is reached then wait for another pattern
to develop before re-entering the market (you may switch currency pairs).
Point 2 we leave in blanck until price touch/is near our D point.
At the beginning of your trading day, you must do a full top down analysis of the pairyou will be trading.
a. Scan through all the pairs you can trade and search for a market that is moving in
a symmetrical manner.
Again???(This point should be on top of the list)
i. In other words, make sure that at least 1-3 patterns have developed to the
point where price currently is.
For this you mean using the same time frame? and… can we go back in time infinetly? I am sure i can find a lot of patterns. PLEASE CAN YOU EXPLAIN BETTER?
I am going to leave it here un til TMB explains better or give an example of what exactly we have to do, then i will continue with the rest of the points :rolleyes:
Could someone give me some advice on the requirements for a gartly pattern … This is what i understand about the pattern:
X must be an extreme of price
B point should be 61.8 % retracement of XA
C Point should be 61.8% or 78.6 % retracement of AB
D Point should be 127% or 161.8% of BC
Is this correct ?
What percentage should point A be ?
Thanks
Dan
Hi,
X will be 100%, A will be 0%.
thanks for the quick reply … so all the other percentages i got are correct ? …becuase i just read on harmonictrader.com that the B point should at a 0.618 and the D point at a 0.786 ??
have a look here when you get a chance:


