FOUR convergences! The first one failed, though. And since the C retracement was near %100, I think this might be a Gartley pattern instead of a Butterfly, and the highest convergence point might not be the real one.
Thanks TMB and yes I was thinking about doing that.
However it looks like they were the Ask prices whereas they should be Bid because I am going to sell. I fixed it now, nothing much changed though.
Here is a pattern I was following but I was asleep when it came to happen… (the pattern is x2, a2, b2, c2 and d2. The ones without a 2 were also a pattern and there was indeed a 30 pip fakeout at that D)
EUR/AUD 15M
[B]And here is a question I asked before but nobody answered.[/B] Can I set a take profit / stop loss order to a entry order? Like:
“Buy GBP/USD when it comes to 1.4799. Sell it at 1.4829 (take profit) or 1.4769 (stop loss)”
Because I can’t find that in FXCM Trading Station, I can’t enter trades like this because I am asleep during those times!
Here’s another trade that I had predicted (EUR/JPY 15M), and could have given me 50 pips (I would have TP’ed at 30) but because of the reasons in my above post I couldn’t enter the trade! Somebody help me!
I thought as much but there is no such option in FXCM Trading Station or Marketscope 2.0…
I think it’s because I’m playing on a demo account. No big problem actually, playing a demo account I could always “imagine” that I am trading without actually trading
Guys I’m very sorry if it looks like I’m spamming this thread, but there is a upcoming Gartley 222 in EURJPY 30M with perfect convergence on 0.786 XA and 1.618 CD.
Moreover, this point lies in a S/R zone area, and an extreme points tracing from the 4H chart has a 0.5 Fib level which is on a 10 pip vicinity with this level.
This looks like a nice trade ! … can i ask you for a favour ? could you or anyone post up the 15 min chart of EUR/JPY becuase i was asleep before i saw the entry on the chart i posted … i just want to see where price went to… cant get the charts up on this computer at uni lol
Hi, I was thinking whether it was alright to start the XA leg at where annihilator suggested, or would it be better to start at the consolidation area to the right since there was a consolidation that lasted some period. Can anyone please enlighten me on this?
TMoneyBags, one thing that i am having trouble with is identiying the next potential pattern once the previous pattern has failed just like the one posted above. Where does the new X go on the chart above ? Also are we supossed to keep drawing the pattern one after … or do we just wait untill we can see a potential X ABC without drawing the pattern, then draw the pattern to find D ? Sorry if this sounds confusing lol
The way to prevent fake outs and possibly profit from them as well is to do a full top down analysis of the pair before you trade it. This way If your do present with your self with a questionable entry or a problem because of volatility, then you will know what your exit and your “re-entry” points would be in the market. As a result, I will go over the pair that you where having trouble with today and give you my top down analysis In addition to showing you how I “fared” today in my trades (please note that my trades might seem off to you in some points of entries because I am still in the process of adjusting the trading method). Never the less, I you will see how and why things happened the way they did today in the market and how you could have profited from today as well (EUR/JPY).
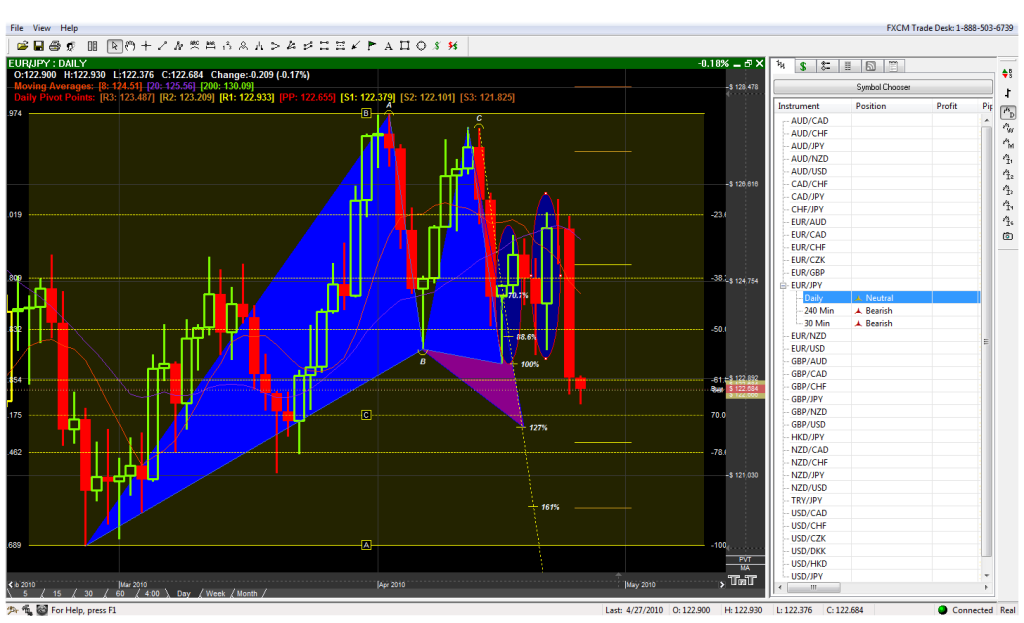
EUR/JPY Top Down Analysis 4/27/2010:
Above we are in the daily chart of the EUR/JPY. As you can see, we have a beautiful ABCD pattern which formed just above the .618 XA level. The pattern developed on the 18th of April and pushed the pair upwards by 248 pips. Please note that this 100% CD where the pattern formed, did not even have a 5 minute close bellow the point. In effect showing that the area of support here is extremely strong and the fact that price wicked exactly from the point and had not returned to “retest” it gives us a hint that the market will at some point return and test the support area. Which is exactly what the market does after it reaches the .500 of the AD target projection (First Blue Circle). As a result (Second Blue Circle) after price retraces from the .500 AD projection, it does a 274 pip retracement and finally reaches the Gartleys full projection point of .618. We will call this “Powerful” Pattern [B]EJ-1[/B]
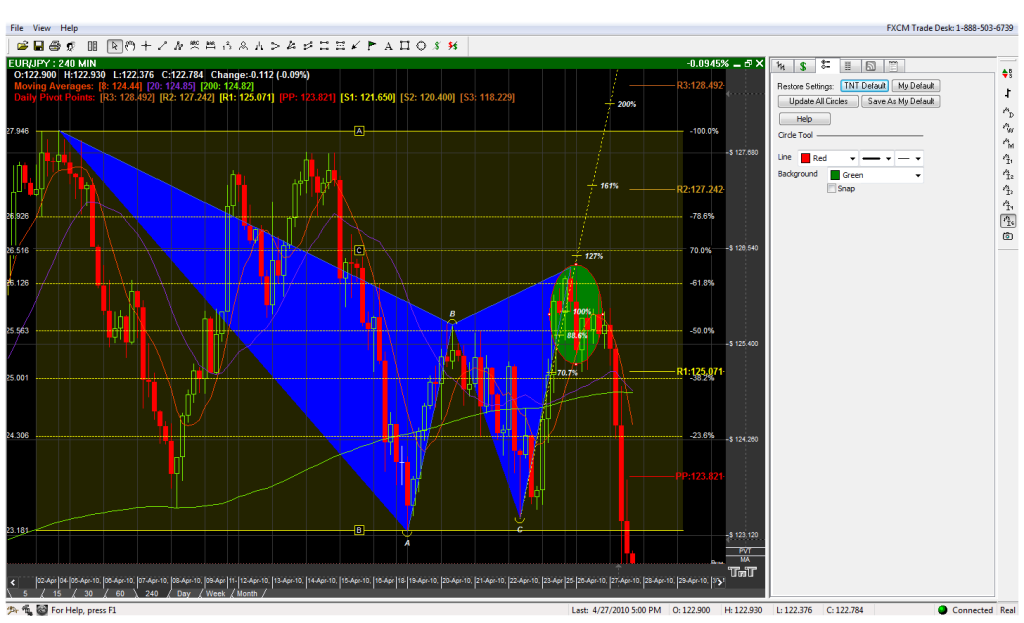
After [B]EJ-1[/B] hits its .618 projection, it forms another major pattern on the on the 4 hour chart (above). In the [B]Green Circle[/B] please note the 4 hour candle stick formations that formed on this pair when it hit D at the .618 with semi convergence of the 127% CD. This major reaction to that resistance area should clearly signal to you that the pair will be heading towards its projected target. Which as for all Gartleys is a 70% chance of reaching the .618 projection of AD. In addition several opportunities of entering the trade had presented itself on the lower time frames as it created a flag before breaking on the down side and executing this move. This analysis alone tells me that I should be looking for short entries If I am not in one at the moment and also looking for points of support that it may reach (being a 4 hour pattern we should look for another 4 hour pattern or a daily one which will stop the swing). We will call this pattern [B]EJ-2[/B]
Please take the time to clearly review the following charts for they are Key to understanding how to avoid a fake out and/or how to exit them correctly:
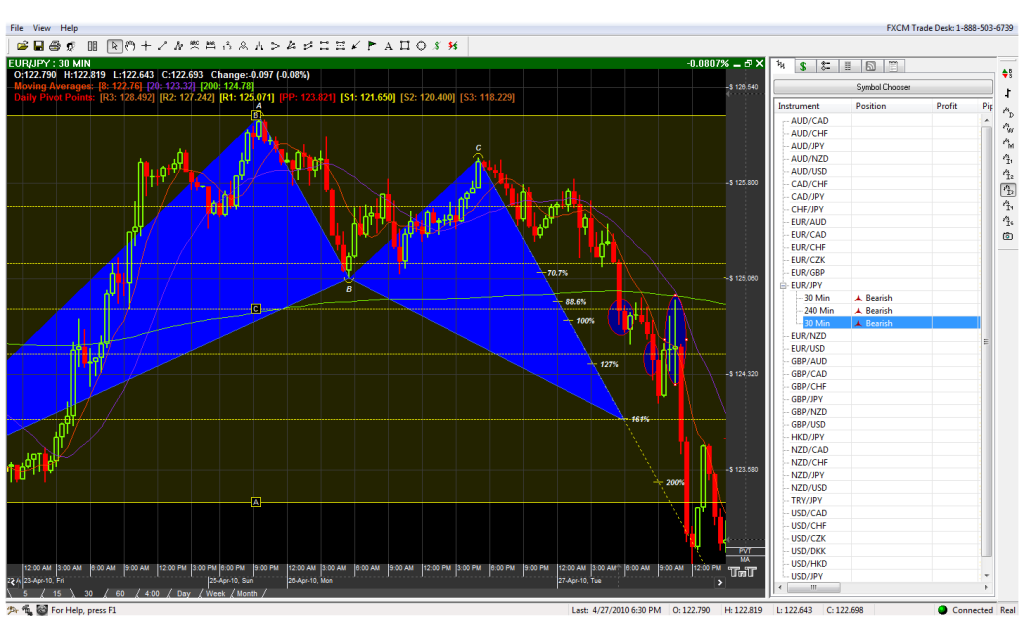
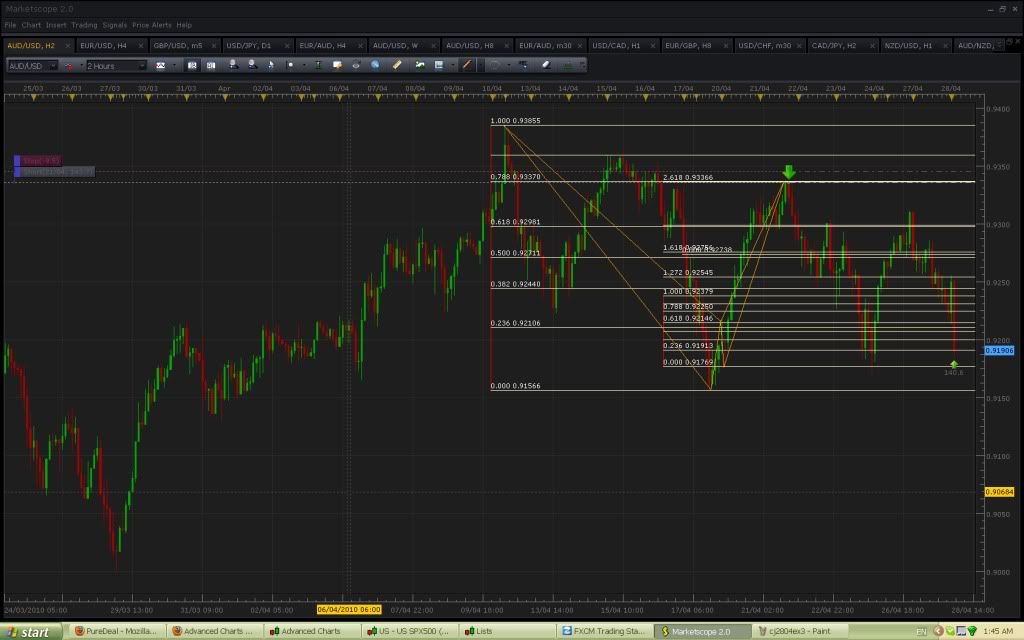
The blue circles here give us bearish candle stick formations. In addition, note that both the .382 and the .500 where blown threw and not respected. For the most part when price “blows threw” major fib levels such as these, we should expect an extension retracement or at least have our eyes set towards the lower fib levels such as the .786 and the .886. Please note that the blue circles indicated above would have been great areas to enter the 4 hour pattern trade if you had not done so with “minimal lots” as a long term trade. Especially after recieving the euro news that came out at the time (Portugal Suffering Greek Debt Contagion Puts Pressure on EU’s Bond Markets).
Above, the blue circle at the .618 of XA shows us that price had reached a 127% CD and .618 XA convergence. Unfortunately though, price closes too close to the area of convergence for comfort ([B]sign of a fake out[/B]). In addition to this, during this time breaking news comes out from Europe: [B][I]Portugal Suffering Greek Debt Contagion Puts Pressure on EU’s Bond Markets [/I][/B]. These hints along with a major 4hour/daily pattern pushing the pair down indicate to us that the EURO/JPY will be making heavy moves towards the short and as a result of this we at least expect a retest of the 100% CD on the daily which was never truly tested (the retracement towards it never touched the point nor did it close bellow it the first time on the 5 min chart).
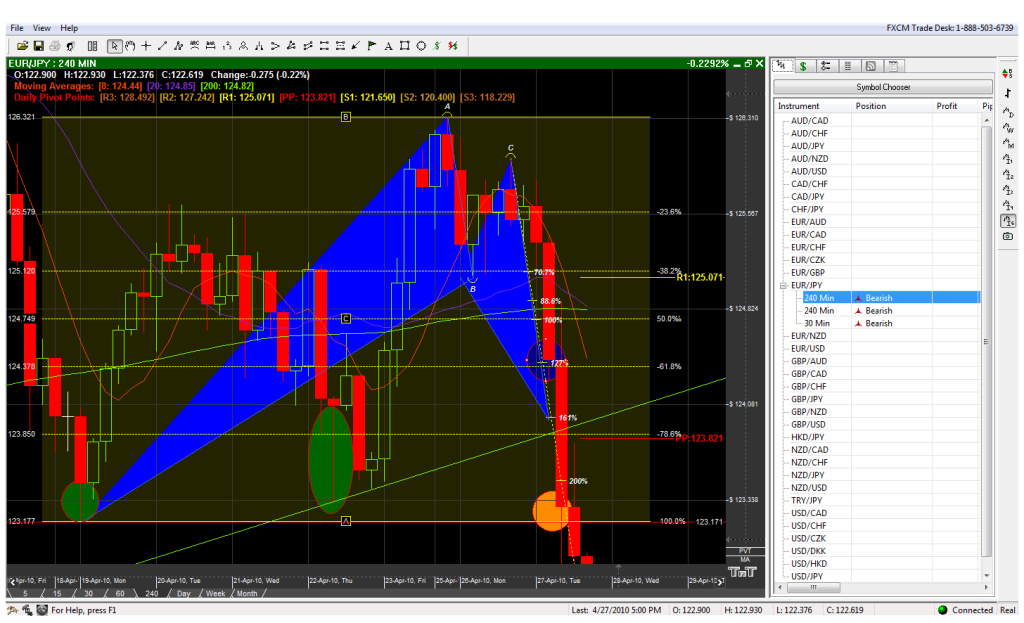
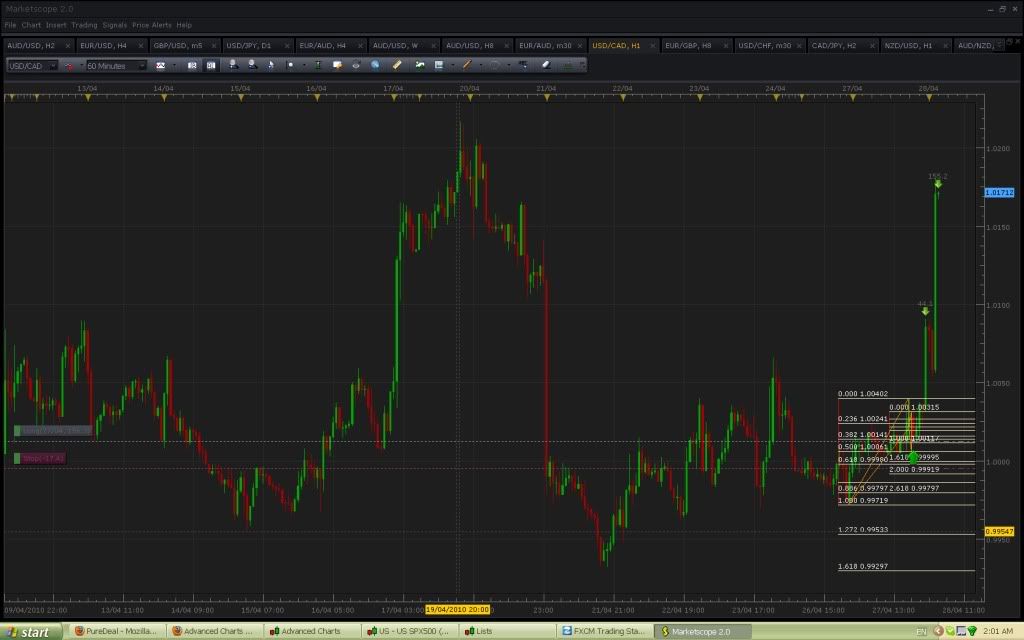
The red line on the 1.0 of XA also represents the 100% CD of the pattern [B]EJ-1[/B]. The green circles focus on the reaction of the market after reaching this D point. The major wicks and hammers that the pair made at this area proves the significance of this point and should definitely be the area where the pattern [B]EJ-2[/B] will first meet its initial point of resistance. This is the reason why we see such a major halt in the market when it reaches it at 9am. A break of this level will indicate to us that price will be reaching the 127%CD of the Daily.
All in all, I can not stress any further how important it is to do your top down analysis of a pair before you enter a trade. I have learned to do this the hard way and also forget to do so at times my self. But once you are in doubt and the lower time frames are “confusing” you then simply sit back, stop what you are doing, re-asses and go towards the higher time frames and look at whats really happening in the market.
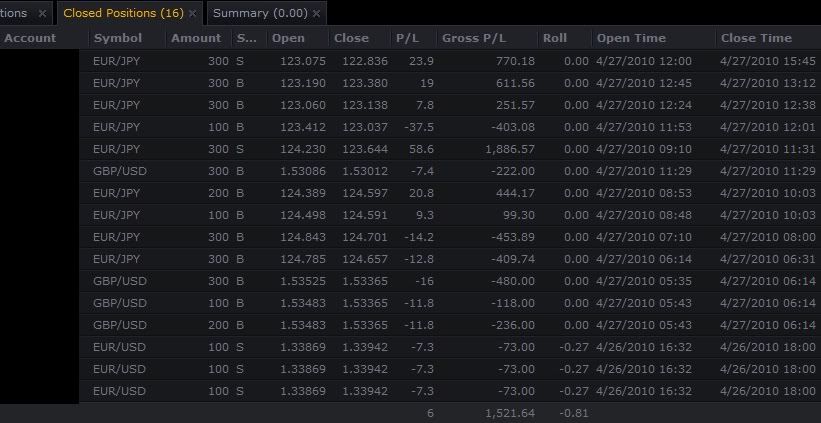
Bellow is my result for the day… and as you can see it was a very hectic day for me as well and I had to do exactly what I wrote on the paragraph above to figure things out. As you can see doing what I stated above can mean the difference between a horrible day and a great, plus profitable recovery. Results
*PS I’m looking for a buy around 121.956 on this pair. Also, expect the EUR/USD to reach a major point of convergence as well.
Thanks TMB, it’s really helpful to see how you analyse the market.
Was a good night for me. No losers + 3%, still holding residual short au and long ucad positions, but have pared back by about 2/3rds.
Of course things don’t always go this smoothly. I’ll be sure to post more of my losers when they inevitably appear.
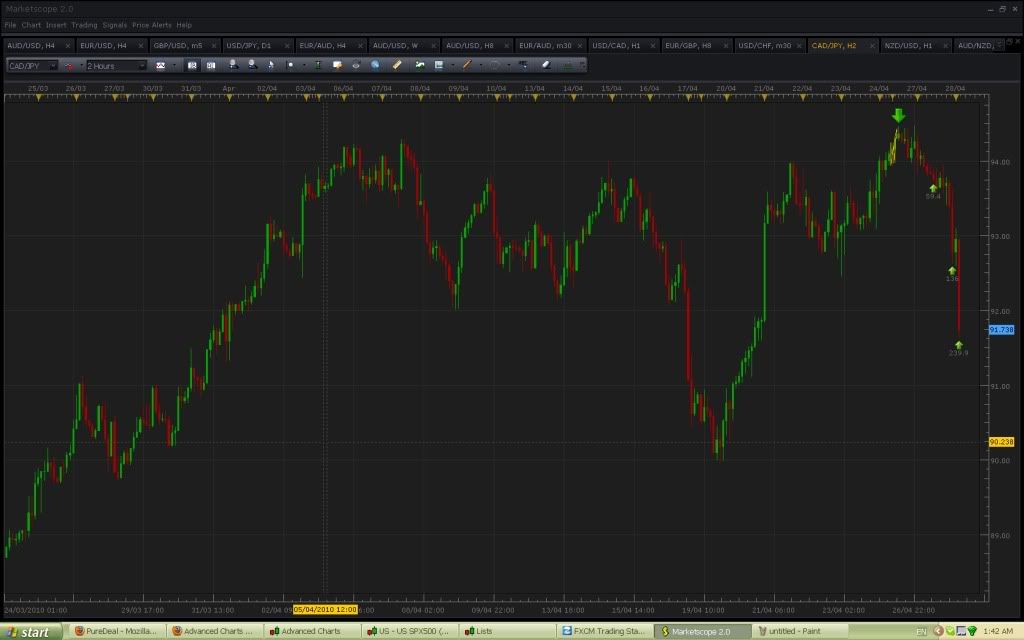
Fibs not on the cadjpy, but I have us in a daily bearish butterfly posted a while back. There was a 1 hour gartley, followed by a 5 min bearish butterfly, which is what i took and got me a nice entry (hard to see on the chart)
The way to prevent fake outs and possibly profit from them as well is to do a full top down analysis of the pair before you trade it. This way If your do present with your self with a questionable entry or a problem because of volatility, then you will know what your exit and your “re-entry” points would be in the market. As a result, I will go over the pair that you where having trouble with today and give you my top down analysis In addition to showing you how I “fared” today in my trades (please note that my trades might seem off to you in some points of entries because I am still in the process of adjusting the trading method). Never the less, I you will see how and why things happened the way they did today in the market and how you could have profited from today as well (EUR/JPY).
EUR/JPY Top Down Analysis 4/27/2010:
Above we are in the daily chart of the EUR/JPY. As you can see, we have a beautiful ABCD pattern which formed just above the .618 XA level. The pattern developed on the 18th of April and pushed the pair upwards by 248 pips. Please note that this 100% CD where the pattern formed, did not even have a 5 minute close bellow the point. In effect showing that the area of support here is extremely strong and the fact that price wicked exactly from the point and had not returned to “retest” it gives us a hint that the market will at some point return and test the support area. Which is exactly what the market does after it reaches the .500 of the AD target projection (First Blue Circle). As a result (Second Blue Circle) after price retraces from the .500 AD projection, it does a 274 pip retracement and finally reaches the Gartleys full projection point of .618. We will call this “Powerful” Pattern [B]EJ-1[/B]
After [B]EJ-1[/B] hits its .618 projection, it forms another major pattern on the on the 4 hour chart (above). In the [B]Green Circle[/B] please note the 4 hour candle stick formations that formed on this pair when it hit D at the .618 with semi convergence of the 127% CD. This major reaction to that resistance area should clearly signal to you that the pair will be heading towards its projected target. Which as for all Gartleys is a 70% chance of reaching the .618 projection of AD. In addition several opportunities of entering the trade had presented itself on the lower time frames as it created a flag before breaking on the down side and executing this move. This analysis alone tells me that I should be looking for short entries If I am not in one at the moment and also looking for points of support that it may reach (being a 4 hour pattern we should look for another 4 hour pattern or a daily one which will stop the swing). We will call this pattern [B]EJ-2[/B]
Please take the time to clearly review the following charts for they are Key to understanding how to avoid a fake out and/or how to exit them correctly:
The blue circles here give us bearish candle stick formations. In addition, note that both the .382 and the .500 where blown threw and not respected. For the most part when price “blows threw” major fib levels such as these, we should expect an extension retracement or at least have our eyes set towards the lower fib levels such as the .786 and the .886. Please note that the blue circles indicated above would have been great areas to enter the 4 hour pattern trade if you had not done so with “minimal lots” as a long term trade. Especially after recieving the euro news that came out at the time (Portugal Suffering Greek Debt Contagion Puts Pressure on EU’s Bond Markets).
Above, the blue circle at the .618 of XA shows us that price had reached a 127% CD and .618 XA convergence. Unfortunately though, price closes too close to the area of convergence for comfort ([B]sign of a fake out[/B]). In addition to this, during this time breaking news comes out from Europe: [B][I]Portugal Suffering Greek Debt Contagion Puts Pressure on EU’s Bond Markets [/I][/B]. These hints along with a major 4hour/daily pattern pushing the pair down indicate to us that the EURO/JPY will be making heavy moves towards the short and as a result of this we at least expect a retest of the 100% CD on the daily which was never truly tested (the retracement towards it never touched the point nor did it close bellow it the first time on the 5 min chart).
The red line on the 1.0 of XA also represents the 100% CD of the pattern [B]EJ-1[/B]. The green circles focus on the reaction of the market after reaching this D point. The major wicks and hammers that the pair made at this area proves the significance of this point and should definitely be the area where the pattern [B]EJ-2[/B] will first meet its initial point of resistance. This is the reason why we see such a major halt in the market when it reaches it at 9am. A break of this level will indicate to us that price will be reaching the 127%CD of the Daily.
All in all, I can not stress any further how important it is to do your top down analysis of a pair before you enter a trade. I have learned to do this the hard way and also forget to do so at times my self. But once you are in doubt and the lower time frames are “confusing” you then simply sit back, stop what you are doing, re-asses and go towards the higher time frames and look at whats really happening in the market.
Bellow is my result for the day… and as you can see it was a very hectic day for me as well and I had to do exactly what I wrote on the paragraph above to figure things out. As you can see doing what I stated above can mean the difference between a horrible day and a great, plus profitable recovery. Results
*PS I’m looking for a buy around 121.956 on this pair. Also, expect the EUR/USD to reach a major point of convergence as well.


