TMB, can I ask what percentage of capital you risked per trade to achieve these results?
Also, was 30 pips the maximum profit you took from any one trade?
TMB, can I ask what percentage of capital you risked per trade to achieve these results?
Also, was 30 pips the maximum profit you took from any one trade?
Thanks for the correction and the awesome analysis, TMB.
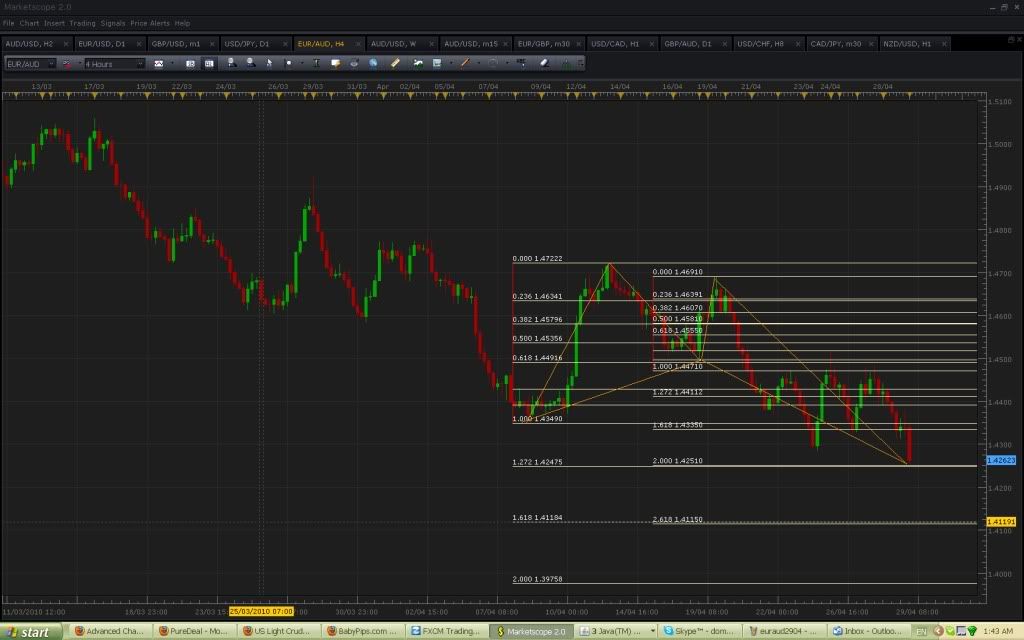
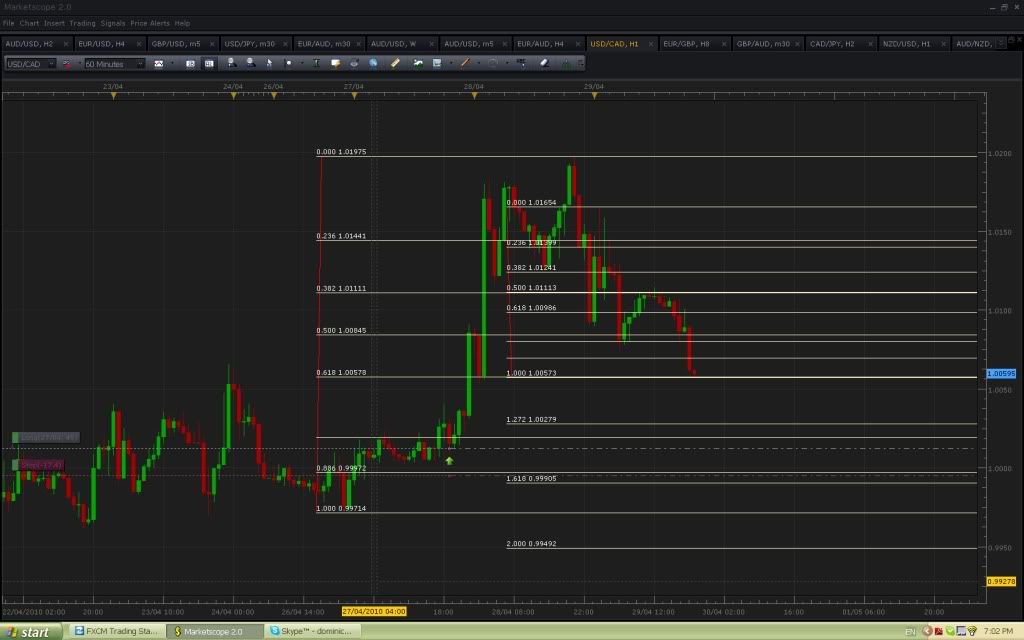
Here is a USD/CAD 1H pattern which has failed miserably. What could be the reason this pattern failed? I think it’s more important to concentrate on the failed patterns on this thread now. There is more than enough info for any beginner to understand how these charts are formed anyway - I think we should concentrate more on our failures and try to understand why.
So, any ideas why this pattern failed?

Furthermore, the same pair failed to respect another good convergence in the 30M chart:

Those failures were greatly discouraging.
Can you tell me ideal Money Management?
Is it still TP 30 and SL 25?
Sorry if this has already been asked.
Newbie 
Failure is caused by incorrect analysis of a market. Concentrating on failed patterns is not the Key. Knowing how to find symmetry in a market is and you do so by seeing consecutive patterns develop and complete themselves through out a pair.
For one, the USD/CAD does not respect fib levels much and as a result I disregard that pair completely. If you want to avoid being faked out as you where on that pair then you must study the pair and see if patterns have developed and completed in the past. To do so simply follow the set of rules that I have posted, in addition to analyzing the pair the same way I analyzed Eur/Jpy yesterday.
I never have had a physical stop loss. I have stated earlier on the thread that I use a visual stop loss and as you can see from the results I posted yesterday, my losses after being “visually stopped out” (30/60 min close past the convergence point) range from of 5-14 pip avg.
*BTW I am re-posting yesterdays analysis because it is important that every one sees this and understands why it is necessary.
Preventing “Fakeouts” and Analyzing a pair:
The way to prevent fake outs and possibly profit from them as well is to do a full top down analysis of the pair before you trade it. This way If your do present with your self with a questionable entry or a problem because of volatility, then you will know what your exit and your “re-entry” points would be in the market. As a result, I will go over the pair that you where having trouble with today and give you my top down analysis In addition to showing you how I “fared” today in my trades (please note that my trades might seem off to you in some points of entries because I am still in the process of adjusting the trading method). Never the less, I you will see how and why things happened the way they did today in the market and how you could have profited from today as well (EUR/JPY).
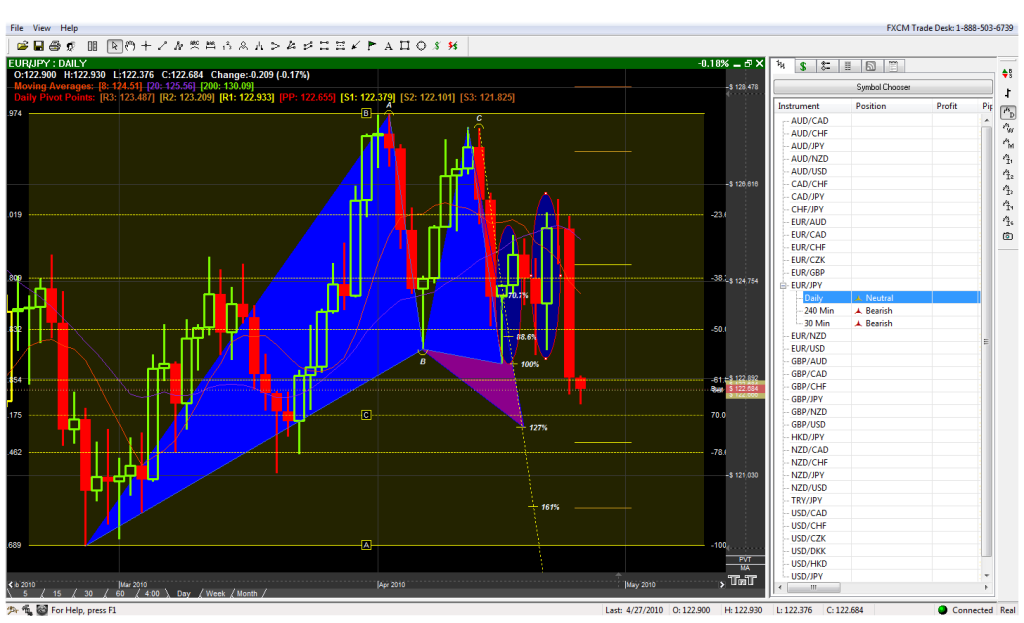
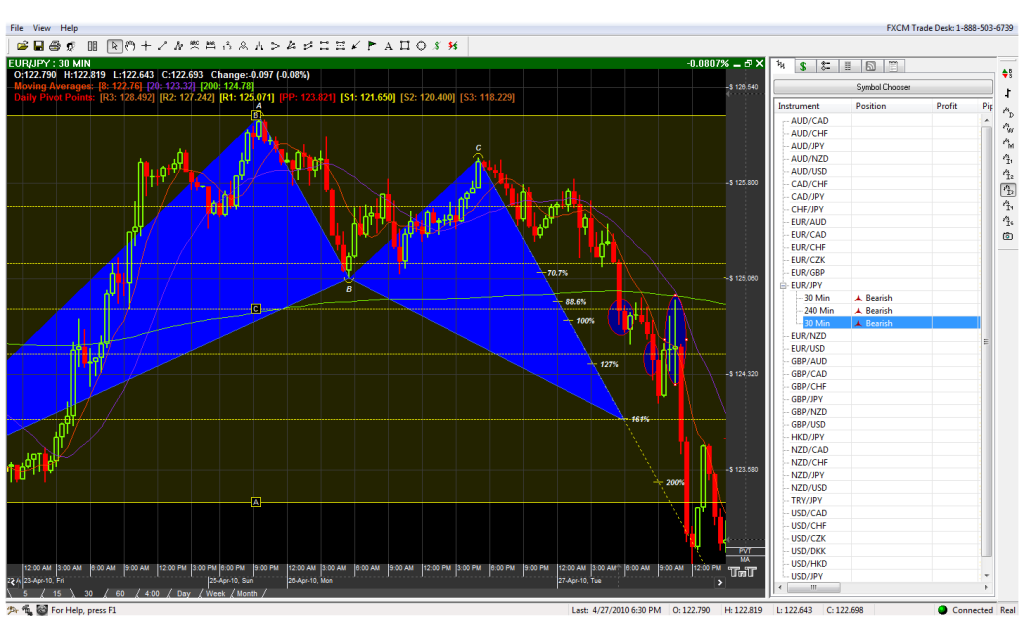
EUR/JPY Top Down Analysis 4/27/2010:
Above we are in the daily chart of the EUR/JPY. As you can see, we have a beautiful ABCD pattern which formed just above the .618 XA level. The pattern developed on the 18th of April and pushed the pair upwards by 248 pips. Please note that this 100% CD where the pattern formed, did not even have a 5 minute close bellow the point. In effect showing that the area of support here is extremely strong and the fact that price wicked exactly from the point and had not returned to “retest” it gives us a hint that the market will at some point return and test the support area. Which is exactly what the market does after it reaches the .500 of the AD target projection (First Blue Circle). As a result (Second Blue Circle) after price retraces from the .500 AD projection, it does a 274 pip retracement and finally reaches the Gartleys full projection point of .618. We will call this “Powerful” Pattern EJ-1
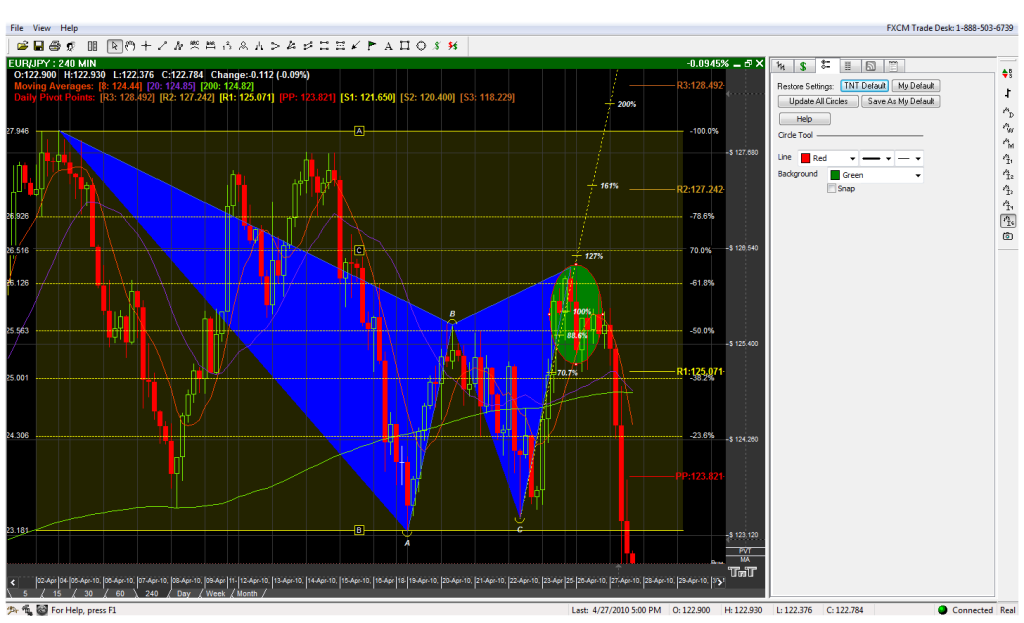
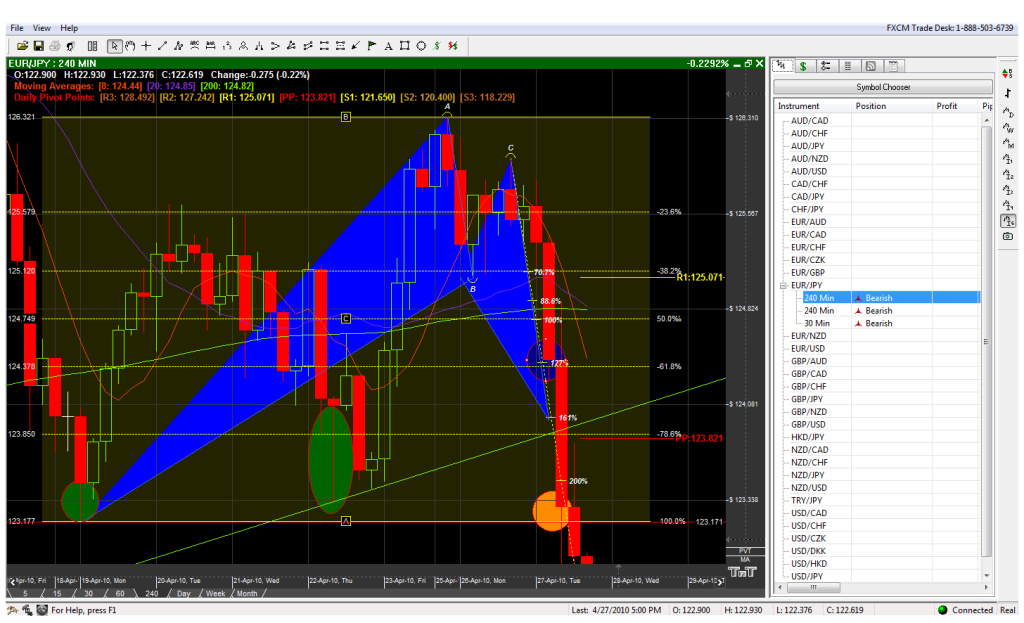
After EJ-1 hits its .618 projection, it forms another major pattern on the on the 4 hour chart (above). In the Green Circle please note the 4 hour candle stick formations that formed on this pair when it hit D at the .618 with semi convergence of the 127% CD. This major reaction to that resistance area should clearly signal to you that the pair will be heading towards its projected target. Which as for all Gartleys is a 70% chance of reaching the .618 projection of AD. In addition several opportunities of entering the trade had presented itself on the lower time frames as it created a flag before breaking on the down side and executing this move. This analysis alone tells me that I should be looking for short entries If I am not in one at the moment and also looking for points of support that it may reach (being a 4 hour pattern we should look for another 4 hour pattern or a daily one which will stop the swing). We will call this pattern EJ-2
Please take the time to clearly review the following charts for they are Key to understanding how to avoid a fake out and/or how to exit them correctly:
The red line on the 1.0 of XA also represents the 100% CD of the pattern EJ-1. The green circles focus on the reaction of the market after reaching this D point. The major wicks and hammers that the pair made at this area proves the significance of this point and should definitely be the area where the pattern EJ-2 will first meet its initial point of resistance. This is the reason why we see such a major halt in the market when it reaches it at 9am. A break of this level will indicate to us that price will be reaching the 127%CD of the Daily.
All in all, I can not stress any further how important it is to do your top down analysis of a pair before you enter a trade. I have learned to do this the hard way and also forget to do so at times my self. But once you are in doubt and the lower time frames are “confusing” you then simply sit back, stop what you are doing, re-asses and go towards the higher time frames and look at whats really happening in the market.
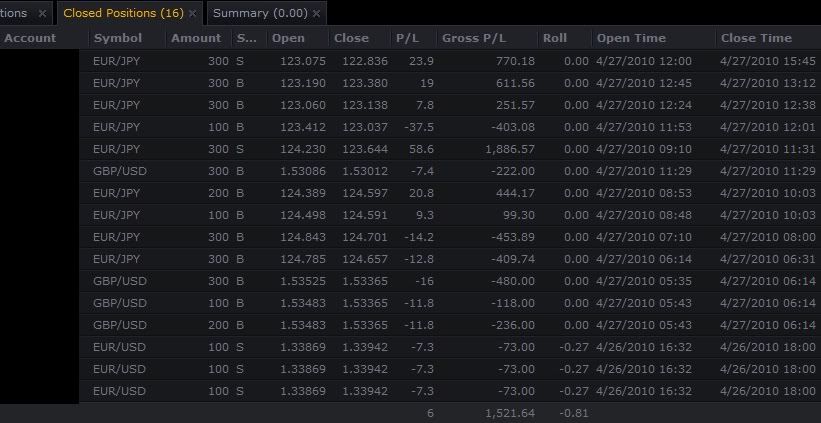
Bellow is my result for the day… and as you can see it was a very hectic day for me as well and I had to do exactly what I wrote on the paragraph above to figure things out. As you can see doing what I stated above can mean the difference between a horrible day and a great, plus profitable recovery.
Results
*PS I’m looking for a buy around 121.956 on this pair. Also, expect the EUR/USD to reach a major point of convergence as well.
good work my man
Could be something here, but note the strong additional convergence further below (more desirable imo)
Given the fact that it’s a 4 hr pattern, it might be best to look for another pattern or candlestick reversal on a lower timeframe. Plenty of upside, no need to rush. More of a “watch this area” than outright entry.
Also note additional convergence below
Preventing Fakeouts and Analyzing a pair.pdf (398 KB)
If anyone wants it
Tmoneybags did u not get my email ?
why not start a room or a chatt or something ??
best regards
Congrats mate, already a 50 pip upwards movement.
Although, at a time it was 24 pips below the entry point.
Thanks for the quick reply. Really appreciate you taking time to share your method with all of us here.
Continued success!!
Hi guys,
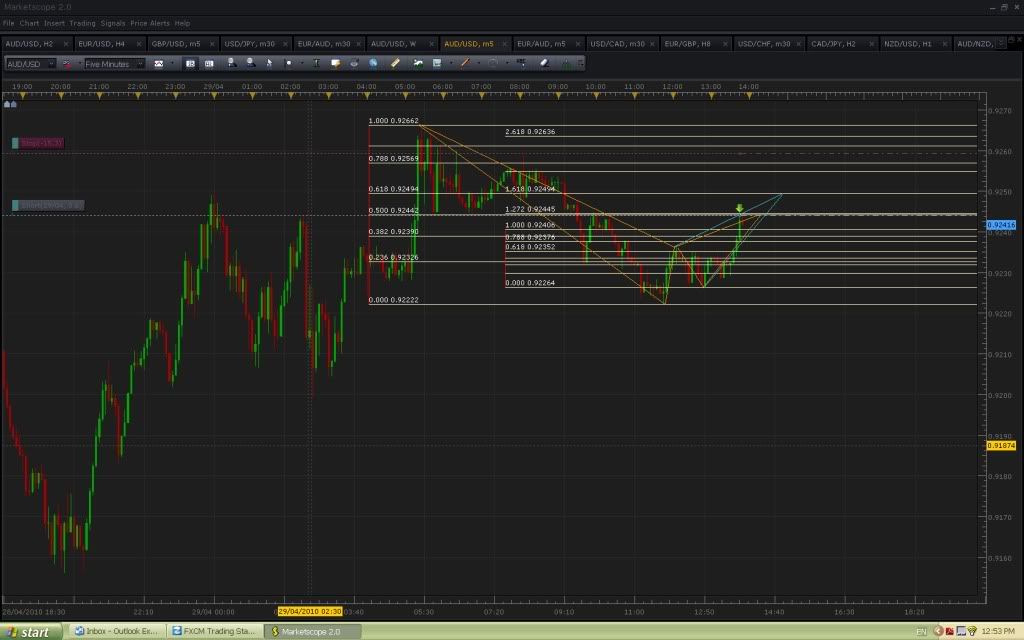
Possible short entry here on the aussie 5 min. There is another (stronger) convergence above, but i chose to take the first for a couple of reasons. 15 pip stop is just above the next XA fib of the second D.
wow, the market has gone completely dead, and this trade has had long enough to work. if anyone is on it i suggest you cover for a 1 or 2 pip gain lol.
TMB,
Maybe you missed this, but if I could get an answer it would be great as I feel it needs to be clarified.
think he missed my post also
this could be worth a look
Question for TMB,
I had some time on my hands tonight and decided to get some practice in with some gartleys and butterflies so I was doing your version of an analysis and went way back and started fibing and drawing. I did this on the daily on both the EUR$ and gbp$. While doing this I had many wicks and candles close above/below the fibs. There were a few that ending up working pretty much perfectly (as perfect as a daily can i guess), but most ended this way. Is this normal for daily charts? Also, I had some gaps between some of the patterns that I just could not work into any patterns… does that mean I did something wrong or is that just how the market moves sometimes. I’m guessing the later but I just would like to bring it to your attn. Thanks man
In the videos he made for this he talked about profit targets(page 2 of this thread). My bet is he lets them run, and takes profit when he sees something he doesnt like.
profit targets that is an easy one he only takes 30 pips that is right he nows he can take more but he only takes 30 to keep him from greed.
best regards

