thanks, my trading performance is very good. byebye, you don´t get the point.
Bye … dont come back please
Hello to all readers, I’m in the process of improving my trading after reading this thread. Can anyone tell me what is the best way to set a stop-loss. Do you follow a specified reward/risk ratio and how many pips do u set? or do u stop yourself out when u recognised that the pattern has failed? For me, I noticed that I often get stopped out prematurely if I follow a specified target pip loss.
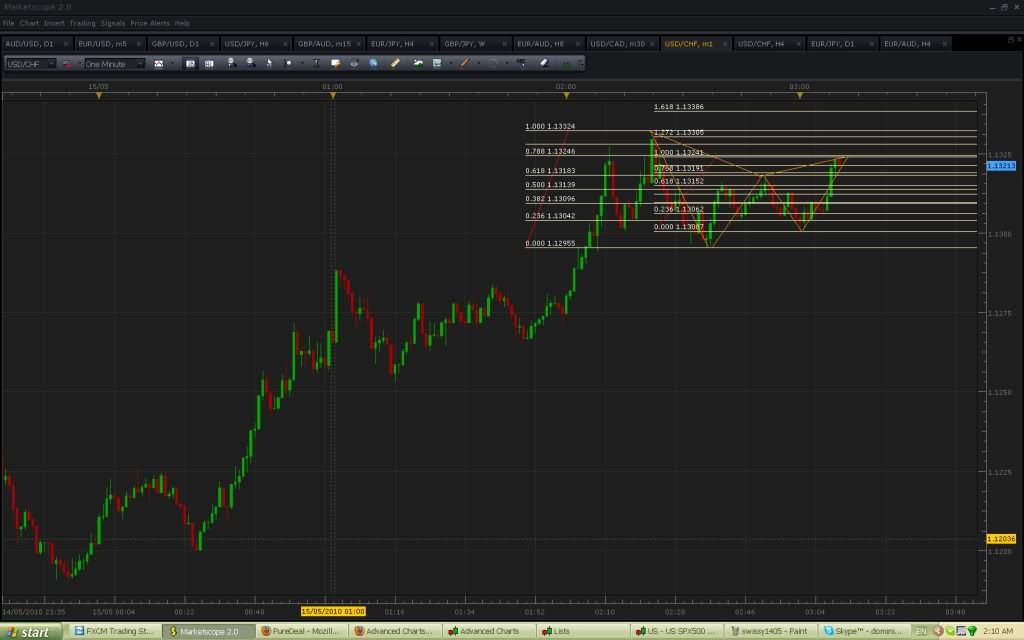
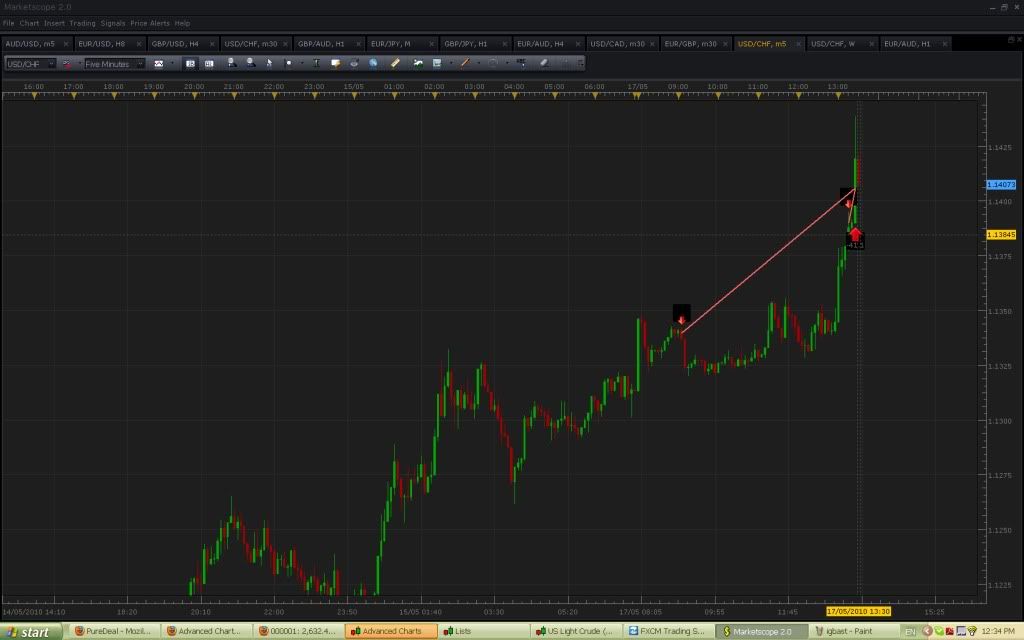
entry on the 1 min into daily swiss short. (above)
good chance it will fail, but for about a 15 pip stop you can get a look at considerable downside.
To me this pattern doesnt look corret … should’nt the X points be at the extreme price futher back from where you have plotted ?
That’s what we call making things “fit”, which is what the majority of people tend to do while learning the system. It is highly important to always go for the extremes of price, on a lower time frame that X might be valid… but their is simply too much info between X and the D point to use a 4/8hr time frame.
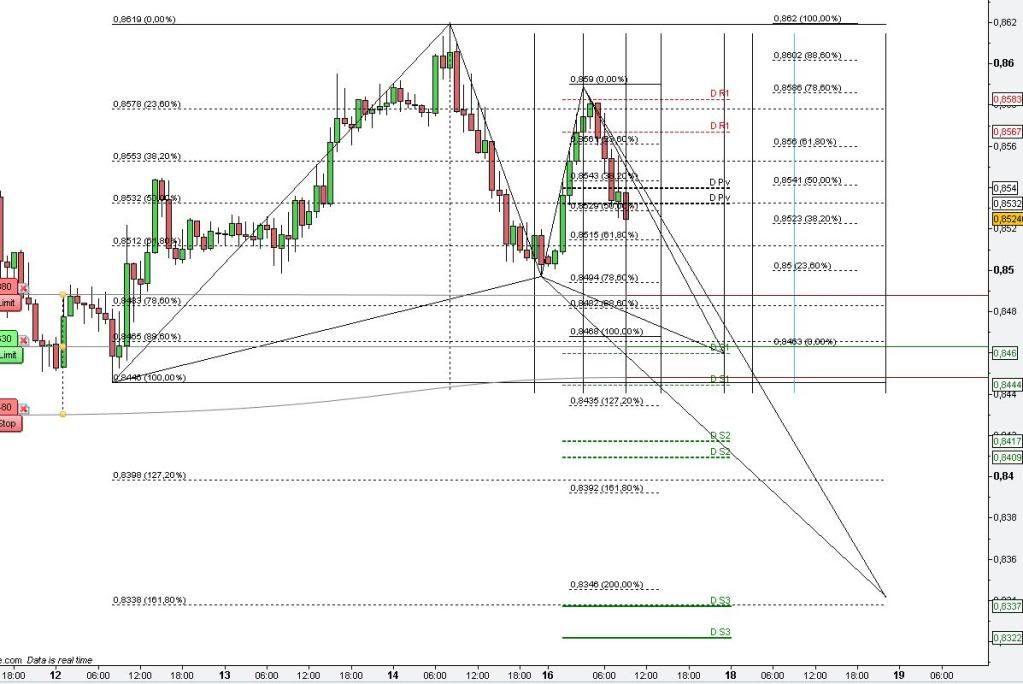
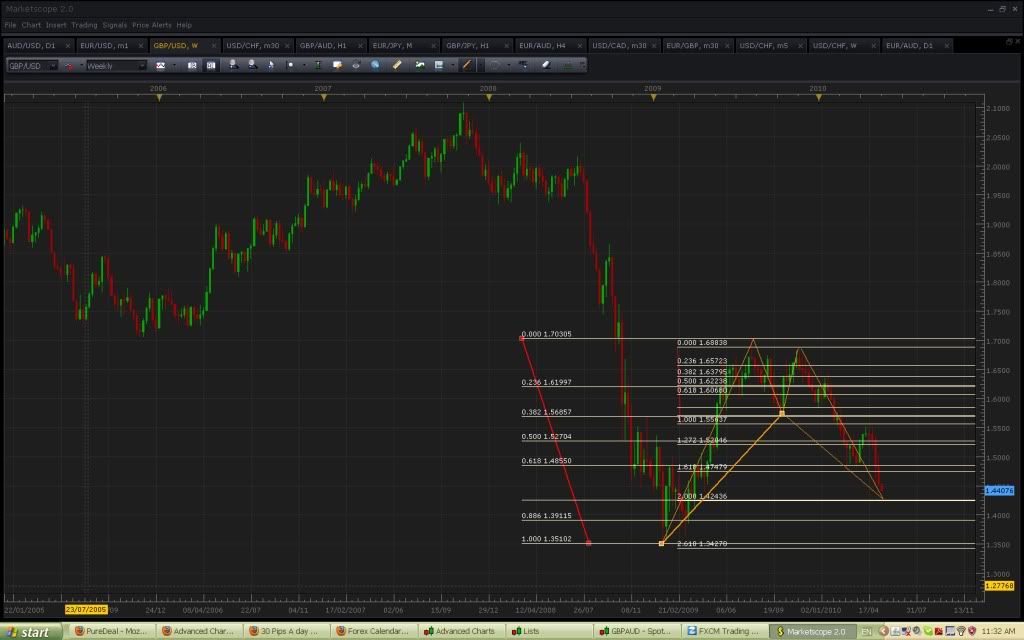
*Note: If you use the correct extreme point which is at the top of 11/15/2008 on the weekly. As a result the major sell pattern for the USD/CHF above 60 pips above from where price has currently closed. In addition, price is currently at its convergence point of 200% CD. As a result, expect price to hit 1.13841 before considering a change of the trend in the market.
PS (the GBP/EUR/CHF have all reached or are very near patterns for their respective pairs) Expect a break or a respect of these points to be major… Good luck trading this month ;).
Please refer to my Rules Of The Trade PDF attached to this thread.
Thanks for the help TMB … so the above chart that was posted is invalid becuase the X point is not the extreme?
Also, anychance you could post a few of the GBP/EUR/CHF you mentioned … or the last couple of EUR/JPY trades you have done. I am really stuggling with identifying the correct points for ABC, and the charts that you have would greatly help me.
Thanks
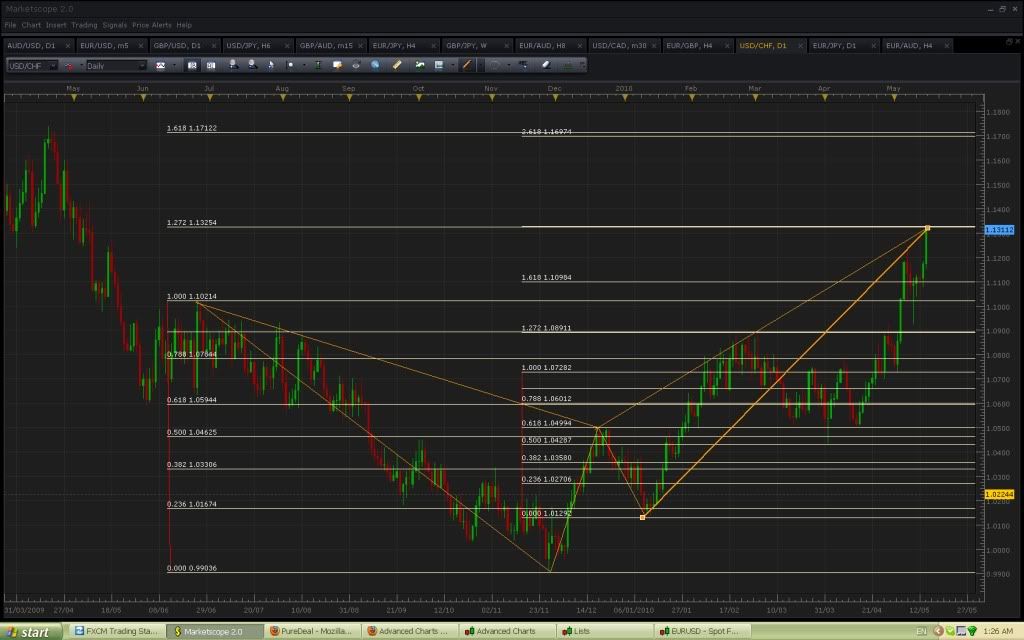
TMB - Could you check if this is the same pattern that your looking at on the USD/CHF Weekly that you mentioned. Have i drawn this pattern correct …?

shouldnt A be at the lowest swing? i.e. 5 or 6 candles before it.
Yeah this is the problem that i keep runnin’ into when i draw these patterns … i thought that we always draw the ‘latest pattern’
if i were to use the previous swing low as ‘A’ then that would mean that B and C would move backwards aswell
Ive come to realise that these drawing these patterns is extremly subjective … i dont see how i would be able to pick the right one … below is 2 more ways that the pattern could be drawn … i think … TMB help …
Like this:

Also you can see that this pattern failed the first time
Or like this:

Or like the one i prevoisly posted
Im so confused !
No you dont need to move the other points just because you moved A. When drawing the abcd it helps to think of the location of the points in a proportional manner.
As i understand it point A will always be at a significant swing high or low. So if you draw point A on a swing low and then a few bars ahead the price drops even lower, that becomes your new point A.
Next you choose point B which would be the next swing high. Or next SIGNIFICANT swing high.
So in an ideal abcd pattern, point C will be at 61.8 or 78.6 fib levels of A to B. If the trend is aggressive its more likely to be at the 38.2 level. i.e. a small retracement.
From here you can then estimate where you think point D will land. If the retracement of b to c was quite short lived (.382 retracement), or if the bars that followed c are of a wide range or have a gap in price, you can expect c to d to be whats called an extension of a to b. Meaning point d will be around the 1.272 or 1.618 fib levels of a to b. A larger zig zag.
If C was around the 618 or 786 retracement of A to B, then you can expect point d to be 1.272 or 1.618 extension of b to c. Meaning a more proportional zig zag.
The above are guidelines obviously your points arent always gonna land right on your fib levels but i they do its a good sign and will make it easier to map out the rest of the pattern.
Below are rules:
-Point C can be only 1.00 fib of a to b or less, i.e cannot be lower than point A. (or vica versa if pont A is drawn at a swing high)
-B to C should be fewer bars than A to B.
-Point D must be higher than point B in a bullish trend, and the opposite in a bearish trend.
I think that covers most of it. Gartley 222’s and Butterflies are just ABCD patterns with an extra leg, they are the foundation of the pattern so its important to get that bit right.
I havent read this whole thread so im not sure if tmb has any rule changes of the pattern to fit his system, if that is the case then what i have stated may be of no use, but hopefully this is not the case.
If anyone here thinks i might be wrong on this please dont hesitate to put it right, i dont want to be responsible for ill informing. As far as i am aware though this is all textbook.
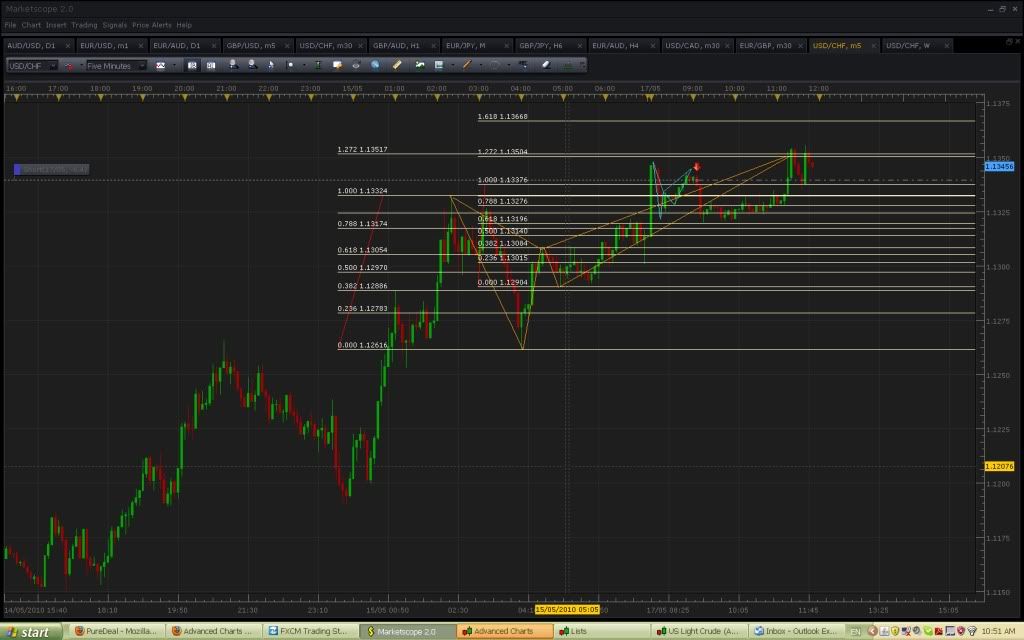
Thanks for the help … well i had a look at the USD/CHF chart again … daily this time … and this is what i got …

Looks good to me (but then what do i know lol), looks like there is good convergence (5 pip difference on daily)
What do you guys think ?
btw i used the weekly chart to determine what was a ‘significant’ point to use as B and this is what i got on the daily … Im not sure what pattern TMB is looking at on this pair … mabey he could post his chart or let us know if this one is correct
this is probably wrong too, just passing it on for you to decide.
as you can see i entered prematurely when i saw 1 min pattern form.
TMB, is this the weekly cable pattern?
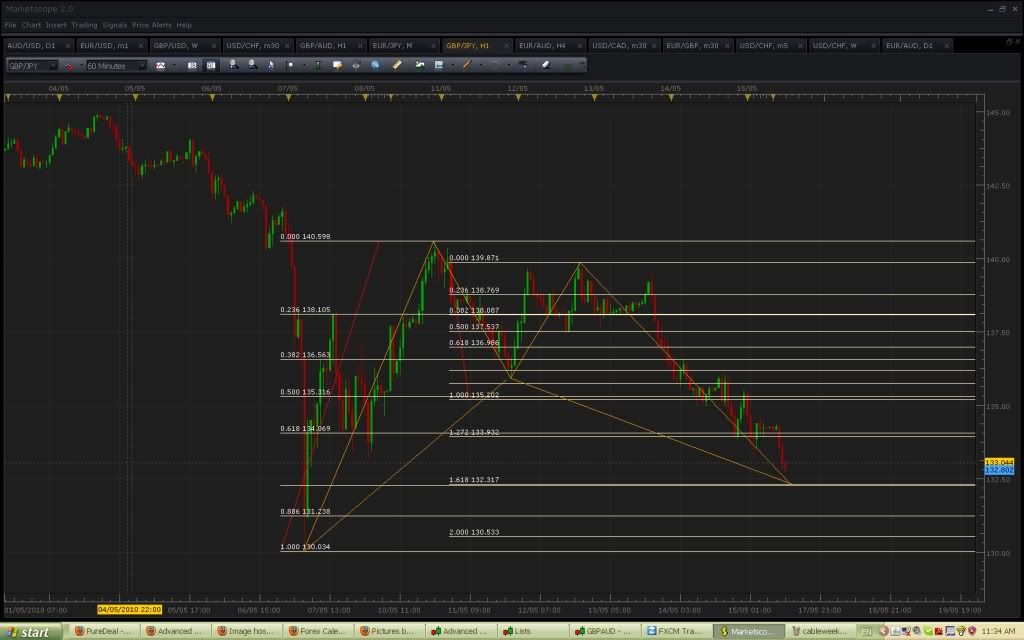
Also noticed this on the gbpjpy, but have daily patterns with D a lot further below. Any thoughts?
Looks like this is going to fail guys. Probably best to cover and wait for Tmoney’s level of 84
Well here is my failed EUR/JPY 60 min trade …

And here is the 30 min pattern that i had drawn and placed an entry order but later decided to cancel becuase the A was not the extreme … this is what im really struggling with … finding the right points for ABC.
This one would have been a great success … also notice that the price bounced of the XA fib levels prettly much perfectly … but if i had of drawn the XA using the extreme A point then this would have constantly failed.

TMB could you explain how you choose your A point … it it always the first extreme swing low or high after X … and how far back on the charts do you go to find this after you have found X ???