I agree that I am trading against the trend on this occasion. I have a tendencey to do that and have to keep an eye on it. So i’m not entirely comfortable with this trade. But i do have a couple of other reasons for being long, not least of which being price action in gold.
I think trading with the trend takes more patience compared to counter trend trades, where the natural inclination is to be a hero and fade the spike, rather than use it as a directional signal and wait for the pullback.
Personally, I prefer butterflies for counter trend trades, as stops from the previous highs/lows have been taken out. This is particularly true on the shorter timeframes where the distance from X to D on a gartley is small in terms of pips.
Hey Highlander,
To usually be safe, yea the trend is your friend. The point of some of these patterns being discussed in this tread is to point out reversals. When these reversals on on larger time frames they change the entire trend direction. Yes it is risky, but trading in and of itself is pretty risky if you don’t know what you are doing and still risky even when you do know a thing or two about it. I can’t answer for TMB regarding trading against the trend but if you look back on some of the trades he has posted (ie a couple pages back) he too uses these pattern (with a very high success rate and frequency) to catch a trend reversal.
If you’d like to learn more I’d highly recommend reading this entire thread like a book. I believe there is far more detailed information on this method of trading than even in the book Trade What You See. Best of luck in whatever you do. When you find a way to trade that consistently makes you a profit, stick to it and stop listening to anyone else.
At what point does a gartly become invalid during the CD leg ? the CD leg on this chart has risen above the C point … does this make this pattern invalid now ???
Hello Dan, yes this would make the pattern invalid. Also when i look at your pattern i notice you have drawed it wrong. Mabey you are aware of this but X and A most be extreme points in the price movment. This would make your pattern invalid becouse A is not an extreme point. In your case, between X and A the price isent aloud to have been lower then X or higher then A for the pattern to be valid
Hi Chris thanks for the reply … yeah i know about the X and A points having to be extremes. The reason why i did not choose the extreme swing high (1st yellow arrow) was because that pattern later became invalid just like the one i posted (due to the A point in my chart exceeding the C point (2nd yellow arrow).
This is one of the main problems that i have … identifying the correct A point … beucase i always thought that you choose the ‘latest’ ABC that has developed like the chart i posted.
There looks to be a butterfly forming on the 1hr GBP$ thus signaling a reversal to continue with the down trend. Not sure if you are still looking to trade only with the trend… but if you are looking to short this pair this could be a good time to jump in. Go check for yourself. ‘D’ should be around the 1.443 area if it is a valid pattern. I already made 100+ pips riding the up trend on this pair from last night and have pulled out because I don’t like to push my luck. I’ll be watching for the short though and might catch a ride for a little while back down some.
[B]*I already got my 30 pips from it so I’m out sorry for the last minute post for this but I had just found it[/B]
You cannot leave price action outside the pattern, if the points invalidate the pattern, then there’s no pattern at all and we should sit in our hand until a new pattern emerges.
Good to see you’re posting your patterns, that way you’ll learn faster and better.
Regarding your original A point (first yellow arrow), I don’t see it being exceeded by C. Also your X point is invalid because it leaves a whole bunch of price action out of the pattern.
Thanks for your post. My wife had been keping an eye on this pattern. Unfortunately she missed a possibly entry on the trade as we had a problem loading charts on our FXCM platform for several hours. Just our luck.
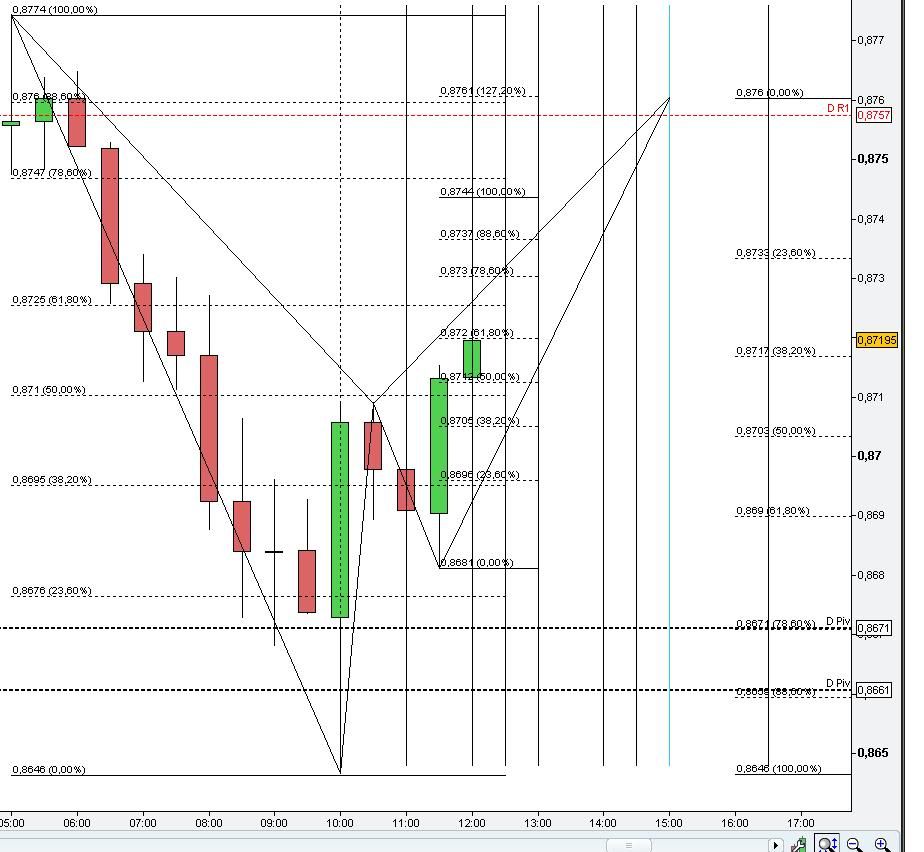
No worries. There are always more to come. Sometimes I sit and look though the charts for an hour just to see that I have no clue what the market is doing and have to walk away for the rest of the day. You never know. Luckily I just found this one once again on the GBP (I like this pair if you haven’t noticed). We’ll just have to see if it comes to fruition or not. Time will tell. When it gets close I jump to the 5min charts to watch for patterns/signs for an optimal entry point. GBP/$ 1hr
Thanks for the chart modo, I’m not watching the trade as the set-up doesn’t fit my personal profile that i have been meaning to ask TMB about and this chart is perfect for my question.
[B]@TmB:[/B]
Notice in the chart given that X is obviously not the “highest high”. Let’s say for demonstrations sake that the the highest peak is that highest candle on the screen and before the screen everything else is also lower making that point “the highest of all highs”. Now if we were to place our X point there, could we not use the current A point as a valid A? I ask this because of the lower trough before it which is the lowest low on the page, seems to me to [B]HAVE[/B] to be the A and all else would be invalid. Is this assumption correct? Or can you use the highest high for an X but ignore the lowest low for an A?
In summery: Can there be lower points between the X and an A in a butterfly pattern (or a higher point between the X and an A of a Gartley)?
Your insight would be most informative as I currently skip out on many trades for this reason. Better to be safe than sorry …
If you used the extreme high on the chart you would have to use the extreme low for A.
My X is “an” extreme (or swing high) not “the” extreme, which I believe is acceptable when trying to find entry into a trend. There will always be a more extreme price if you move back far enough. I believe the abcd corrective move relates to the XA leg I have selected, but the problem I have is whether the trend is still intact.
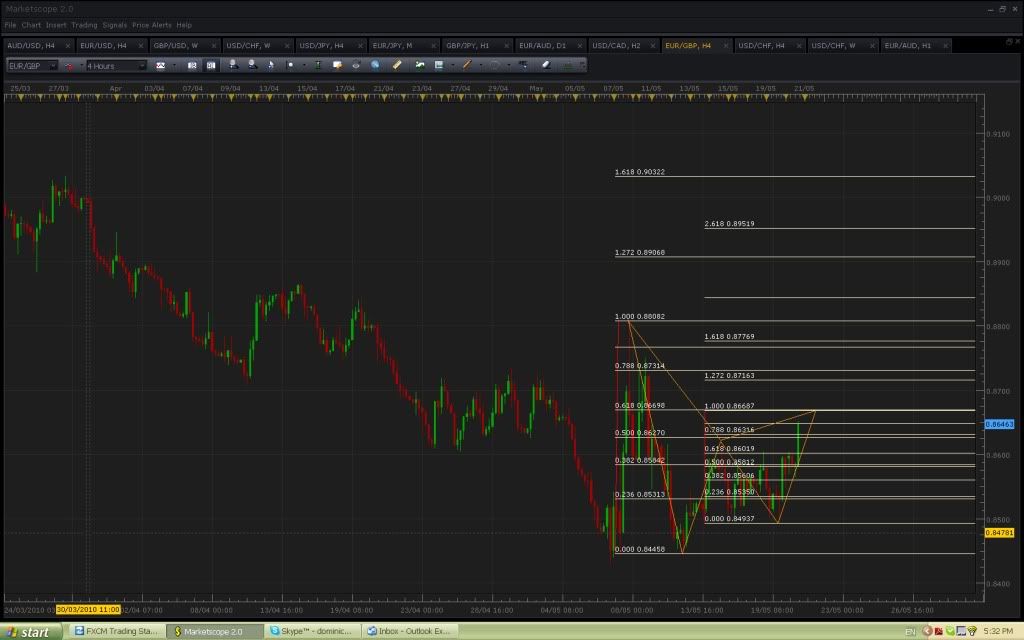
Hello folks, possible Gartley uppcoming on EUR/GBP 30 min, convergece nicely with a pivot point. There is also convergence at 0,881 as a butterfly, the candles is very bullish in the CD legs so be carefull. Do as you like
This might be a silly question so i appologize in advance… but im confuesd as to how we identigy an X point … i know that it has to be an extreme … but how far back do we go to find that extreme ? Chances are you will always find an Extreme higher then the extreme …