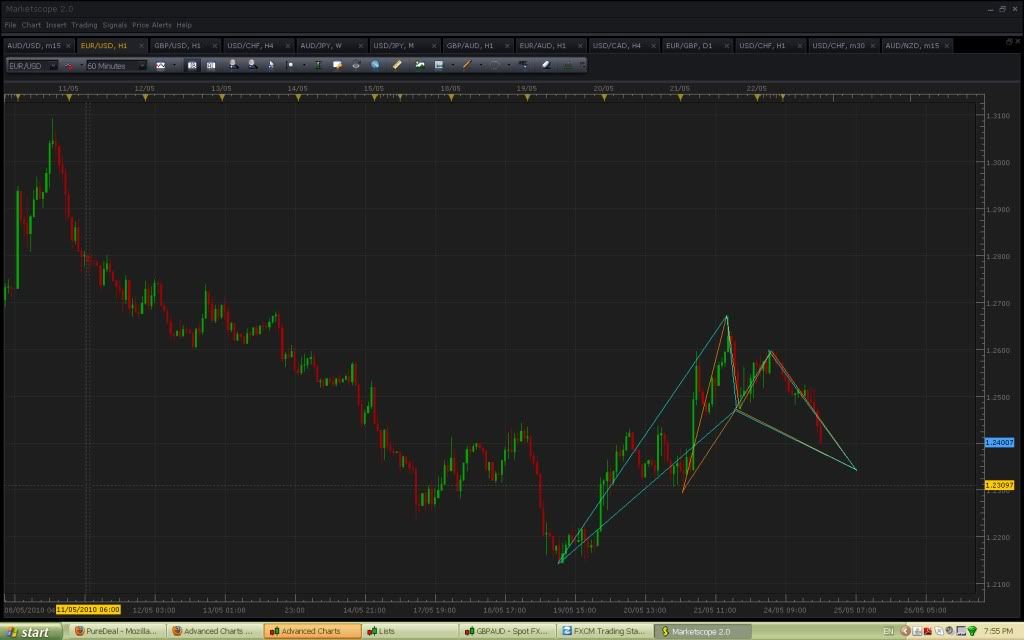
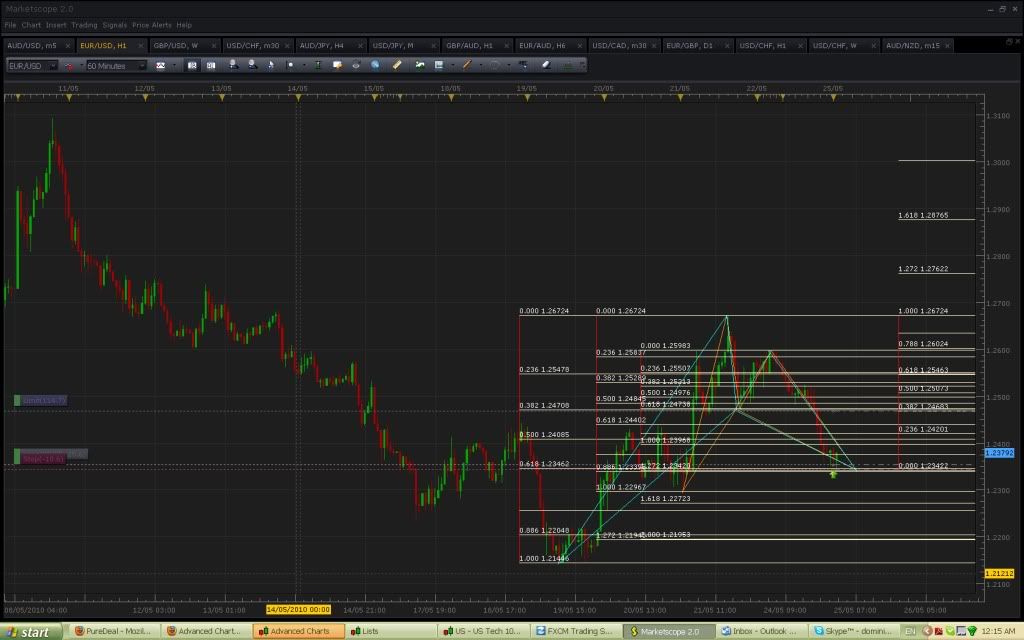
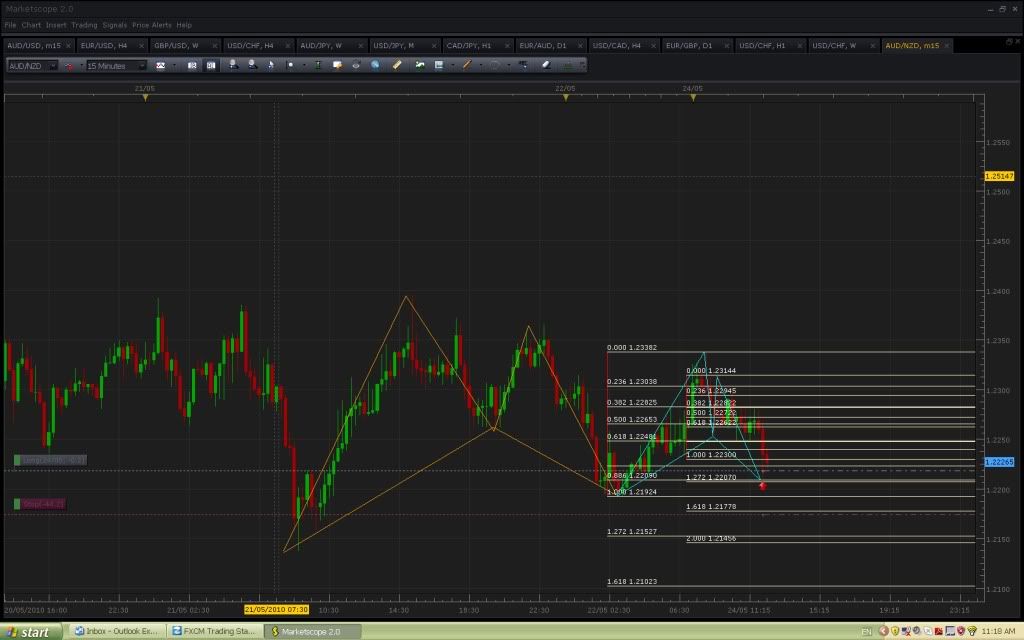
as you can see the convergence is at 127,2% of AB and at 88,6% of XA  looks like the pattern is failing anyway
//Chris
as you can see the convergence is at 127,2% of AB and at 88,6% of XA looks like the pattern is failing anyway
//Chris
Yea… 'm quite curious too. If the currency pair has been through a persistent up/downtrend, identifying a valid X can be quite challenging in my opinion. Can anyone share your opinion on this?
at least im not the only one lol
you really should judt the the book ‘trade what you see’. This will solve all you problems relating to these patterns. Failing that, just go look up the ABCD pattern and learn the rules of this pattern. 10 minutes learning this and any confusion u have about these patterns wiull be solved.
Anyway, if the X was to be a high point, the A would be the next LOWEST point, so you wait until a low is hit, then if it starts going back up then that was your A.
If it starts going down again and goes lower than your A then that now becomes your A point. A will always be the lowest point in your XABCD, or vice versa obviously if the pattern starts with the X at a swing low.
Seriously though, just look up the abcd pattern, forget gartley and butterfly for 5 mins and understand how the ABCD works.
Dan, what I did is to look for the best convergence point for my D. Because identifying a valid X can be quite subjective (as least for me), the best convergence for D may not be so for say B or C. But I’m disciplined enough to keep my profit target to 30 pips, so I’m usually not susceptible to wild rides in the financial market should I pick an invalid X. This works quite well for me.
To add on, if the market is going through an up/downtrend, I would pick my X after the market has gone through a correction that satisfies the fibonacci ratio. Can anyone tell me whether this is the correct way to pick my X?
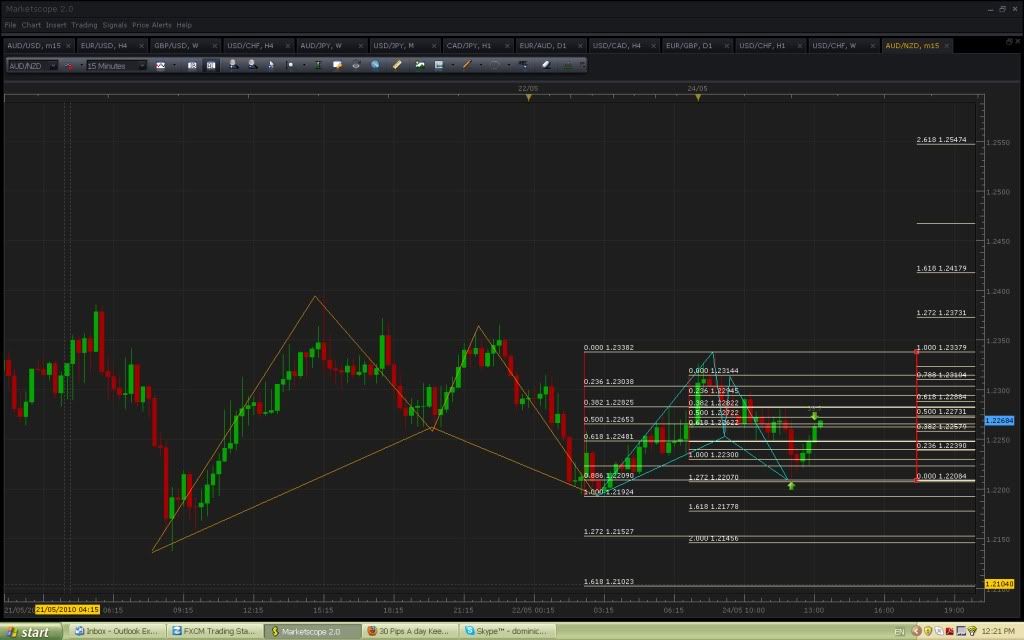
thought there might be something here. good reaction at D on the previous pattern, so entered on second shorter term pattern.
sorry for late notice, got there in a hurry. aussie new vehicle sales out in 10 mins.
This went to plan, got out at .382AD for quick 1R (39 pips)
Does anyone know at what hours patterns tend to complete, i.e. when does the D form?
I read this somewhere in this thread but having trouble finding it.
Hi Naughtypip,
Trading hours are towards the bottom of the attachment.
Thankyou Modo 
TMB goes over it in the first few pages,
i missed my limit on this by a couple of pips. not really liking how it’s trading, so have pulled my bid.
well, i ended up taking it, but i still don’t really like it and have just a 10 pip stop
sorry for the indecision, i was being a pu$$y
hey modo, do you trade live or demo??
Eur/Cad, 30 min chart.
Trading a gartley here on demo, convergence @ 2.0 and .618.
Im new to these so let me know if I’m going wrong… :eek:
I trade live. Lucky exiy here, bailed a littly short of the .236AD for 56 pips because I had a bad feeling about it.
I’m having another look here as price did not reach .236AD, and on the off chance that we just saw a little fakeout into the asian open. Not hopeful though, feels very heavy.
I think 2.0 and 1.272 is looking like where it might bounce, convergence in spot on here too…
yeah, you are probably right. i took a loss on this trade.
buying crude now basis that second convergence.