Here is a pattern I saw on the Aud/Jpy and I was wondering what you all think about it. Personally I don’t like the X point but let me know.
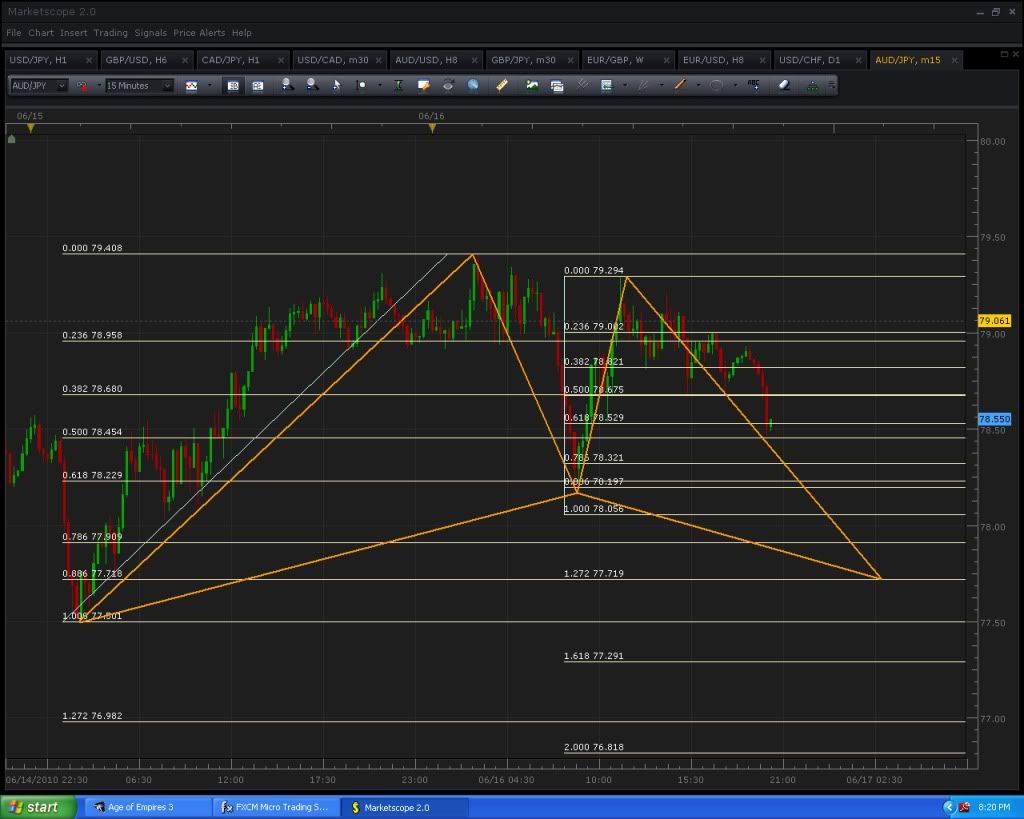
That looks pretty good and straightforward to me. I would check higher time frames for convergences, though. It seems to me that 15min charts can be really untrustworthy, if that’s a word lol.
BTW the EURGBP trade’s still inconclusive, I go from 0 pips to 3 and back all the time. Looks like good resistance in that area and bears/bulls wars are raging.
BTW there’s an upcoming Bullish Gartley on M30 EUR/CHF coming shortly. The X is at 1.3736 and the D is 1.3853 with exceptionally good convergence (the B point is the first swing from the A).
I am going to check the pair for higher time frames.
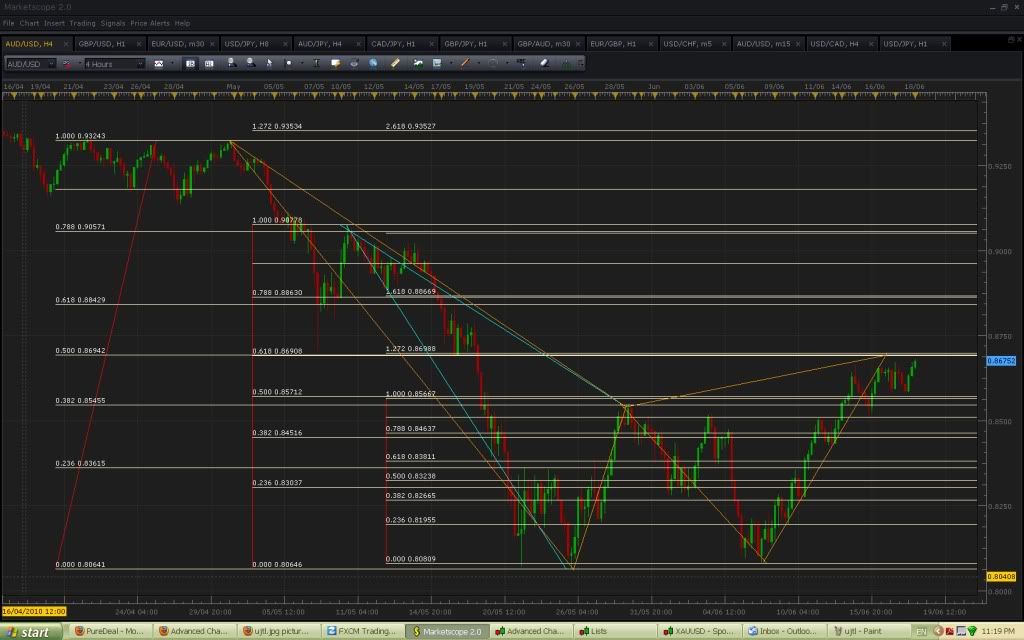
I’d be careful with that pair… when its not around a .786 lvl it can get really crazy. Especially since it hit a daily pattern for a buy (the lowest low was the retest) and a 4-8 hour pattern for a drop (the cause of the recent fall) -_-… a tricky pair to trade and one not to get caught in especially when your lingering like you are at the moment (in addition to the .786, .886 that pair really follows through with basic triangle patterns so keep in mind that you might be in a flag right now waiting for a break).
BTW If you look at your 4 hour… you are testing the B leg which broke the 4 hour .232 of XA starting 5/7 5am to reach the 382 and 100-127% CD extension. AS a result… this pair right now is in “no mans land” and can go either way. All in all, I suggest catching the EUR/USD drop if you get a good entry. Good luck, heading to bed and I’ll analyze this for yall tomorrow (just glanced at it and using prior analysis for my judgment.
Remember about two months ago when selling yen was all the rage, particularly against the dollar.
For what ever reason (flash crashes, new prime ministers, equity weakness etc), the long uj trade seems to have faded from the news…enough for me to start thinking about it again.
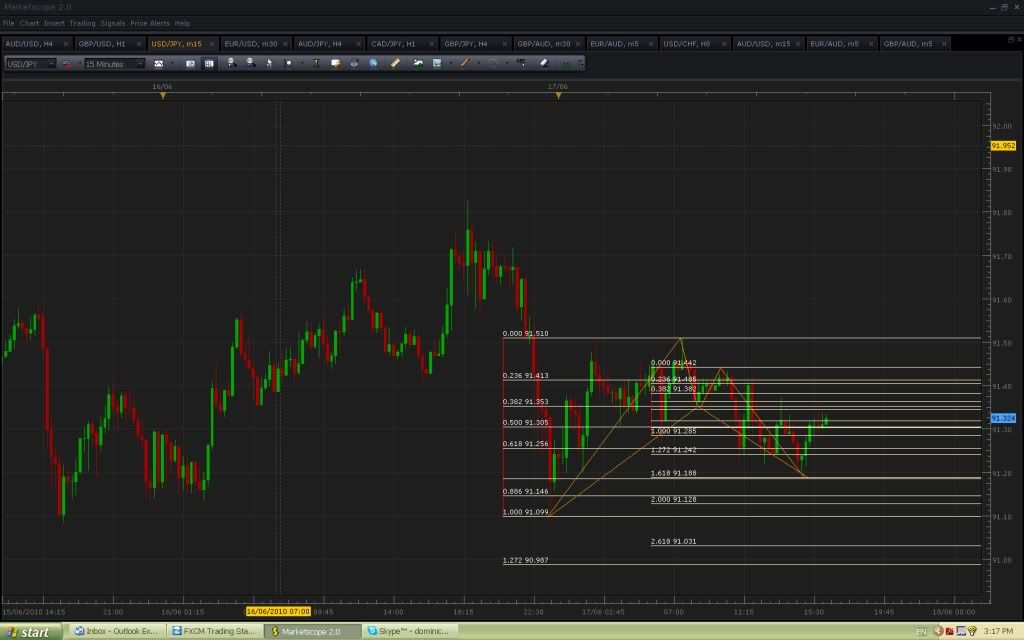
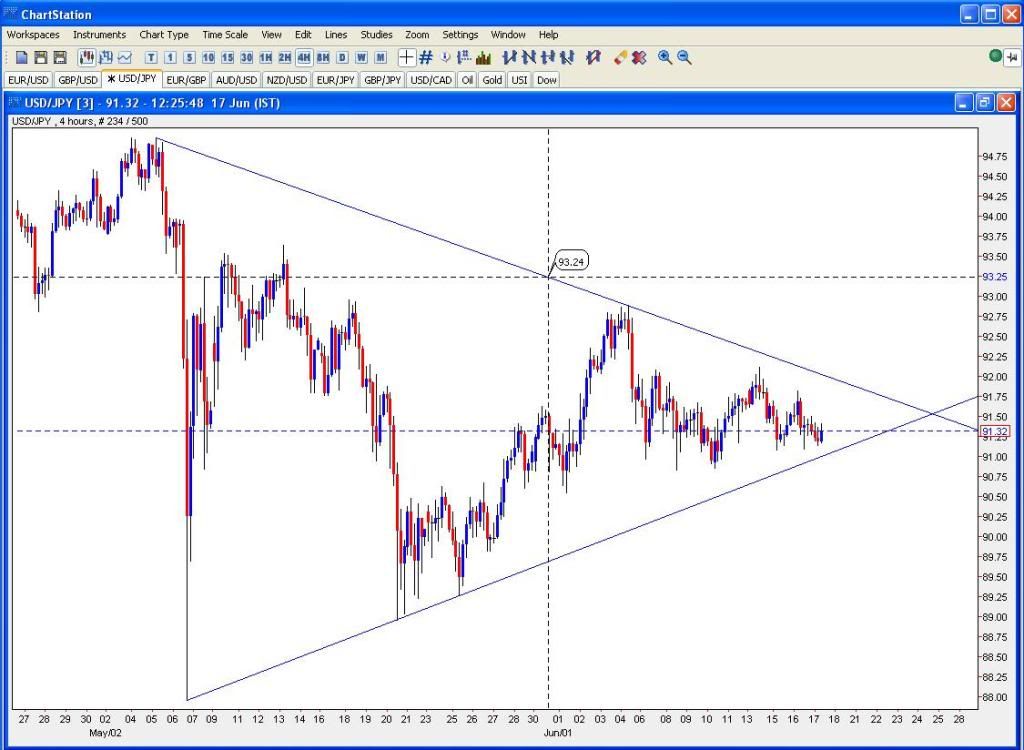
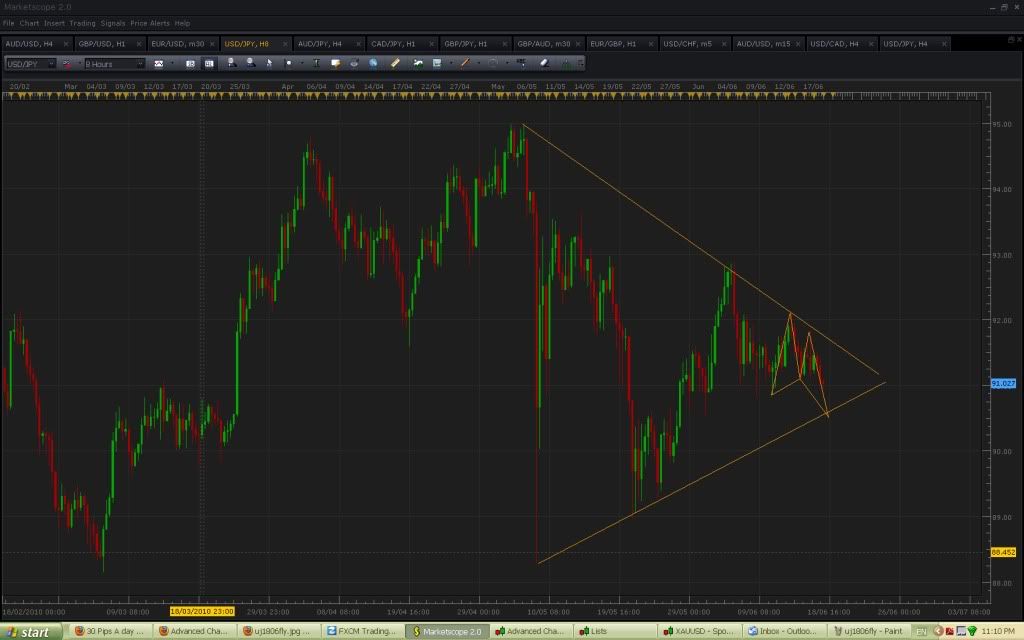
The pair has been trading in a 100 pip range for the last 10 days. Not entirely unusual for this pair, but i do feel we are on the verge of some volatility…one way or the other. On the daily charts price seems to be coiling up like a spring in a large pennant formation.
It could well be that we will move sharply lower. Better data from Japan of late has given the yen a bid, and of course it gets some flight to safety. Also, over the last week or two the yen has been supported even as equities rallied, which is slightly unusual and hints that the old correlations may be unravelling. So there are plenty of arguments that the yen gets significantly stronger.
BUT, lets not forget that Japan has an enourmous amount of debt (albeit domestically held), and in this current environment I think it’s concievable that once europe is shored up attention could turn to Japan.
So, on that basis I have taken this little 15 min long pattern. The chances of failure are high, but with a stop at 91.11, I am happy to test the waters. No doubt I’ll be back here in half an hour wiping the egg off my face.
SNB appears to indicate that they are standing aside from currency intervention for now and price plummets 100+ pips in EUR/CHF and nearly 200 pips in USD/CHF. I missed it due to work… doh.
Update on our EurGbp, it failed after going 20 pips in the correct direction. Luckily I tightened my stop before bed, lost 10 pips. Im blaming the low liquidity in the market at the time. Onward to my next order at .844 :-).
Im considering a long here in the 1.088/75 zone. x being at 1.044 looks to have been respecting the fib levels of the main and extensions fairly well, but skipped the 38.2 on the back of the snb news.
EUR/GBP 4 hour charts - possible bearish Butterfly forming with X at 0.8360 and D at ~0.8386. Not trading it myself as the poitns aren’t extremes and I think GBP has weakness in it but will have a look to see how it works out.
Argh, EURGBP trade has failed. Luckily I moved my stoploss to cover the spread after it made the 15pip move, so I haven’t lost anything. But the trade has failed which I don’t like. 
TMB had warned us about the pair, however I didn’t understand a word from what he said, lol.
I was thinking of longing EURCHF because there was a good pattern with convergence at 1.38532, but with the SNB news it blew right through it.
This means that even if I don’t like it I simply have to follow the forex news to see if there are major news coming out.
Also the positive retail sales news seems to push GBP higher, making it closer to reach the double convergence (4H/1H Chart)

hi all …i was wondering can anyone explain the massive 180-220 pips candle that apзeared on almost all charts like from nowhere…it on 14 06 10 16.00h gmt…i checked…there were no news at this time and i am sure it wasn’t there yesterday…its like the charts rearranged over night…
Only pairs with a CHF moved that much, and it was because of the SNB press conference, saying they were stopping measures which eased the franc.
I’m keeping an eye on this one too and will be waiting for a potential breakout before placing a trade.
I’m hoping for a break to the downside personally to set up a good long trade over the next few weeks.
The US is going to issue huge amounts of US Treasury Bonds to help finance the deficit. These bonds will have to yield higher due to the sheer number of them. These will be probably be popular with Japanese investors as the yield will be better than the Japanese bonds. This should in turn send the USD/JPY rate significantly higher… hopefully anyway 
Other pairs did too. EUR/USD went from 1.2242 to 1.2397 for example.
The Asian session dragged things lower for a while - concerns over EU debt, etc. However it seems that a successful debt issuance by Spain and decent UK retail figures has comforted investors again and the “risk on” mode took over once more.
The markets seem to want to go up lately and are seizing on anything. I’m not sure how much sense it all makes but it looks like this upward bump is set to continue for now. Any setbacks have been very aggressively bought.
Well, I got stopped out but you’re right, I should have waited for the breakout. Lost 0.25% on the trade, which is all that I was up for the week. Sux balls.
hey, what about this one guys, or should i just let it go.
here it is in the longer term context, on trendline support, but those levels would also signify a significant break of horizontal support.
Im betting this will break higher, the $ index is looking like we are going to see it stronger in short order, although another short push down is likely. Im currently flat waiting on all the consolidation to end. I think Im going to use this to get another long term possition on xaueur going. Probably hang on to it until the euro is trading in the 1.65 range. That should give me the most bang for my buck.
Back on topic, anyone spot this on the daily audjyp yet? Darn near perfect.

also watching this, but you probably wont agree with one of my X’s (i chose it because i thought that’s where the move and wave count started but am probably wrong)
could hit at a nice time of day.
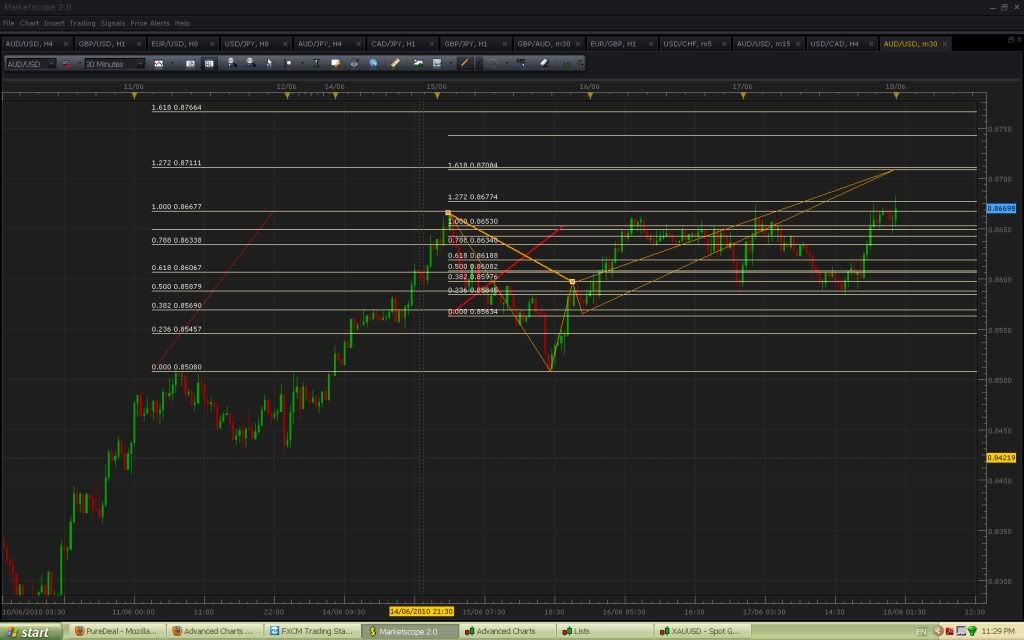
and there is this on the 30 min with D in the same place, although the patten is questionable
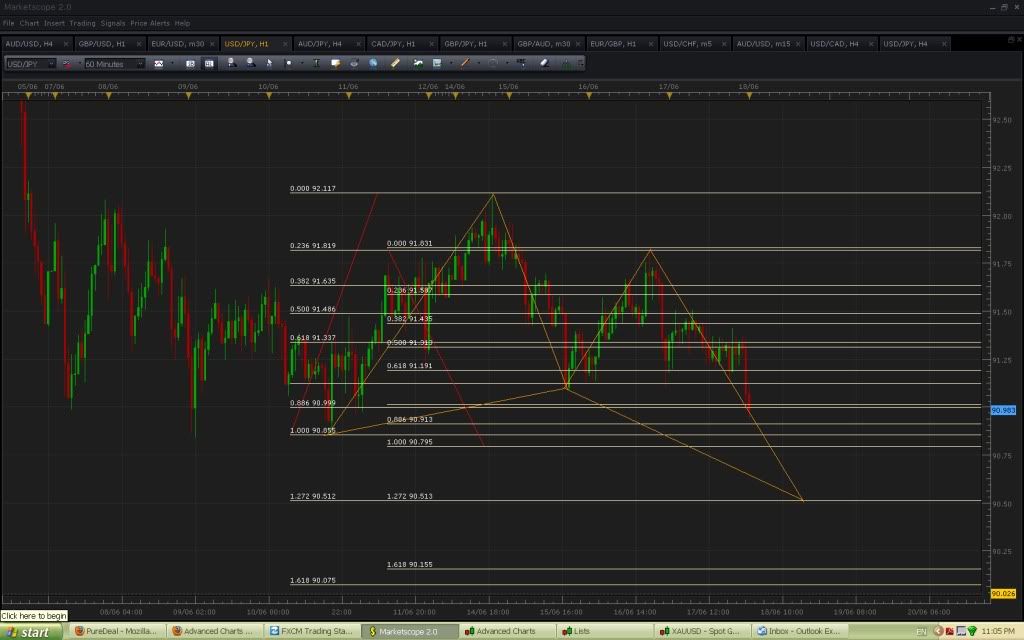
interesting modo, your first USD/JPY (1h) chart doesn’t fit with mine, mine is different around those points
ok, ill look into it, but i’m working a 54 bid