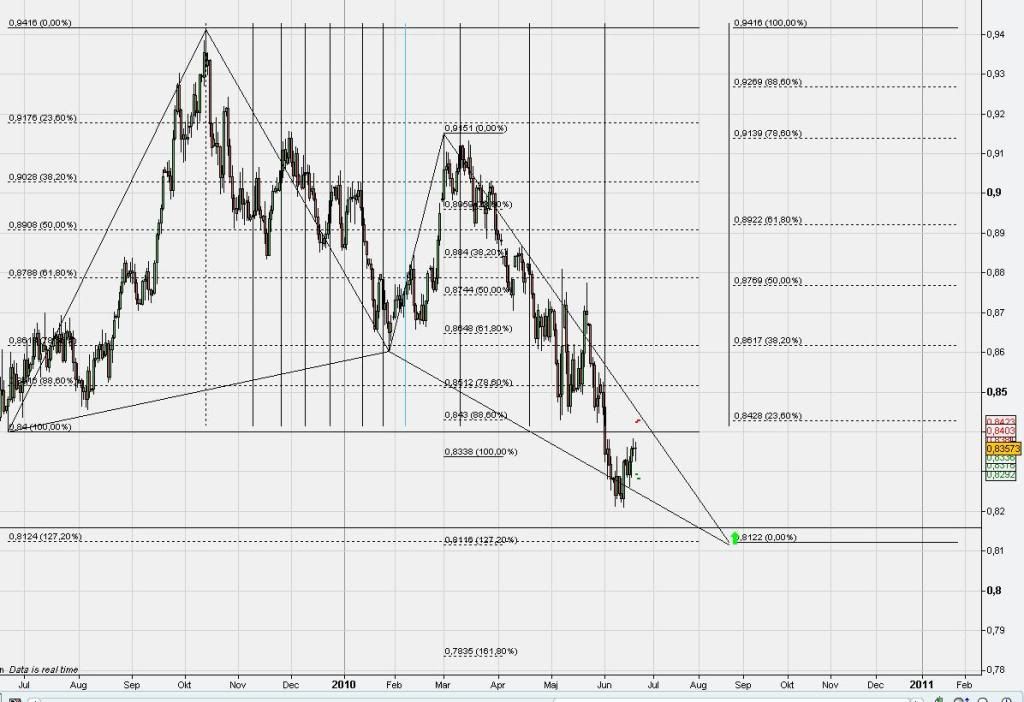
Really good convergence on this one, might be a larger retracement? Seartching for other patterns with the Euro in it to validate the turn over in the price but havent really found any. Still might be a good one if you can find a pattern on a smaller timeframe futher ahead that convergece near the D in this pattern. Use the info as you like guys
i already traded this today at its first convergence, unfortuanately i screwed up my entrance being impatient which made my 30 pip profit target a couple of pips out of price range, so i lost out. Lesson to be learnt for me!
^The trade above didn’t work either, for me. My stoploss is 20 pips.
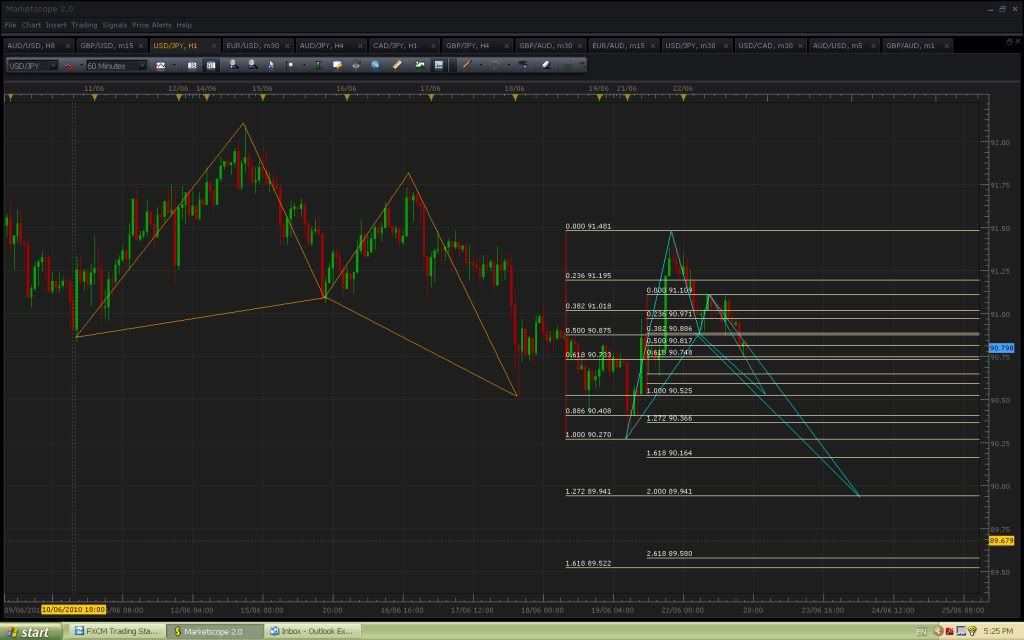
The first convergence was a success but the second failed. Which is a pity since the second convergence was better than the first (1 pip vs 2 pips), and if I had seen this I would trade the second instead of the first. So this goes as a FAILURE on my chart.
However upon closer inspection it’s evident that the 1.2359 line was solid S/R so maybe the earlier convergence was the way to go.
But then if you make the chart 60min instead of 30, and draw fibs from the lowest extreme you’ll see that it converges around the 1.272 CD fib line (the one that failed)…
From the patterns I’ve seen where there’s a period of sideways consolidation it doesn’t seem to bode well for the pattern’s reliability. I prefer to go with ones which display nicer symmetry.
Hopefully any patterns involving GBP will become a bit clearer after the emergency budget is released tomorrow.
It appears like there’s going to be large spending cuts to narrow the deficit. I’d guess this will have a weighing effect on GBP. I’m not too hopeful about it reaching that ~1.5030 level we’d identified on the 4 hour charts a while back. You never know I suppose though! I’ve being burned a few times this week trying to use my little crystal ball to predict where price is going to go. Will only be placing trades off these patterns from now on.
Are you talking about any of the legs in particular PipBandit, or after the entry at D point or in general?
I agree that there’s a time element to these patterns which are seldom talked about (dunno if it’s discussed in this thread - haven’t read all of it). They can be “fibbed” as well (I don’t), but I usually just take note of the # bars forming the pattern and timeframe I’m trading to let it play out.
These patterns are reputed to be highly reliable, on the order of 70%. I’ve only been trading them a short while and don’t have a large enough sample size but from what I’ve seen, it’s thereabouts. Depends how you define reliable really… :rolleyes:
In terms of symmetry, I totally agree, it’s just more aesthetically pleasing! Seems to be ‘perfect’ when it occurs in nature (waves, seashells, human body) but it’s hit and miss when it comes to human emotion and chart patterns though.
Incidentally, there was a study done that found human faces that were more symmetrical were found to be more attractive! More than meets the eye… I dunno.
There were some great trades in the JPY pairs last night, e/j g/y cad/j. And spot gold/silver - was stopped out on gold last week and re-shorted with the push to new highs last night. Massive moves in the these 2.
I’m still holding silver. You can see:
beautiful convergence of 150% XA + 261.8 of BC
price holding 1st target @ prior S/R, X point with convergence of 138.2 BC, 50% CD
Luckily, I held on to my failed patterns, ‘Never give up on a trade’ as TMB would say, and they formed new D’s right on the maximum convergence, pulled out 60 pips


 Seems to be ‘perfect’ when it occurs in nature (waves, seashells, human body) but it’s hit and miss when it comes to human emotion and chart patterns though.