Your Gartley Looks good, but it already hit it’s D point. Look at 100% of AD it lands right at .886 of XA and retraces back .618 of AD. It’s a valid gartley because the retrace of your BC leg was more then .500
At least that’s the way I see it.
Your Gartley Looks good, but it already hit it’s D point. Look at 100% of AD it lands right at .886 of XA and retraces back .618 of AD. It’s a valid gartley because the retrace of your BC leg was more then .500
At least that’s the way I see it.
For easier access to the various charts that I have offered throughout the thread, in addition to charts shared privately between my self and my partners, please refer to the following:
Direct Link to TMoneyBags Chart Album
*Note May contain misc pictures of my self and family as well.
Nice observation Belthazar. Alas on the proper chart (an ‘Ask’ chart) this is not the case, as my second post should indicate.
Regardless, looking at the chart now the price has turned up again, which renders this trade opportunity null and void. But thanks for your comment Beltz, much appreciated. Whilst learning a new system, one doesn’t always observe every aspect of it immediately, but hopefully that will come with a little more practice.
Thanks for all of these charts in one location TMB, looking forward to reviewing them after work.
GL to all going at USD/JPY Gartley, I’m still waiting for that to hit it’s D
Also as a note, USD/CAD just formed a double top and moving down.
Hi TMB and friends,
can anyone advise on the pairs they feel best works with gartley and butterfly patterns? i am reading through the posts on this thread but havent seen the answer to the above question in the first 150 pages!
i have seen mention of the EUR/JPY, AUD/USD, GBP/USD, EUR/USD, USD/CHF & NZD/USD by TMB, i just think it will be beneficial for all newbies like myself to have a better idea of the pairs that work best.
much appreciated guys.
Its really about what market is moving “symmetrically” at the moment. Their is no one magical group of pairs that will always work 100% of the time. These patterns develop in every market that has a fear and greed factory (stocks, futures, forex, bonds, commodities, etc…). I have stated this many times through out the thread and I’ll say it again, simply look for charts where previous patterns have developed within w/e given time frame and stick to those until the symmetry breaks up. For example, In the beginning of summer the GBP/USD, EUR/USD, and the USD/CHF where behaving very irregular and had biased (ranged) moves through out the day (lack of buyers or sellers). On the other hand, pairs like the CHF/JPY, NZD/JPY, (Majority of yen pairs), etc… where all moving fluidly and forming pattern after pattern on a daily basis. Now, we are starting to see the markets stabalize as they get comfortable with the current price range and we are beggining to see trades develop on the GBP/USD and the EUR/USD on a daily basis again (30/60min patterns). All in all, everything’s basically touch and go (simply analyze the charts and determine where you should take your trades).
my last post was in reference to the above comment, as in if there are any pointers with reference to pairs such as the USD/CAD that you can advise us on? are there any further pairs that you have experience of faking out more often than others, therefore do not trade?
Thanks bro, hope u dont mind all the questions!
The best pattern recognition indicator out there is… yourself!
I’ve seen this question bounced around before and while they are out there, they are wholly unreliable. It also takes discretion to trade these patterns, the type of discretion one does not dedicate when mechanical indicators are used. You would be doing yourself a dis-service to try and trade using them so I wouldn’t even entertain the idea if I were you. It takes practice but they’ll start appearing to you and eventually you’ll see them everywhere.
Good luck
racerdude777
I’m coming to the same conclusion myself. I’ve taken a quick look around and found a few (korHarmonic and ZUP to name but two), but they don’t seem to live up to expectations, and for the very reasons you mentioned. So good point well made racerdude 
Come to think of it, I guess that’s one of the main attractions for me with this system, namely the fact that one can produce better results manually over an indicator designed to trade the same system.
I have never relied on indicators to establish my trades, and I have no intentions of starting the practice. Yet I am always willing to keep an open mind, hence my curiosity regarding such harmonic indicators.
Thanks for your opinion racerdude, I’m now of the same. 
At what point do you say, I missed that trade?
I’ve been watching the USD/JPY and saw a beautiful set up, at least “I” thought I did. If the attached picture where big enough for you to read it, you’ll see the red line come within 8.5 pips of the green line.
Now this green line has AD 2.000 and two possible XA lines, one with .618 the other with .786 all landing in the exact same place. So I figured that would be the point D, but was not hit by 8.5 pips and has been progressively going down.
Any thoughts?
heres an EJ im trading, still only demo. almost hit profit target in the time it took to get a screen shot!
you can see that the initial X point i used to spot the pattern, there was actualy excellent convergence using that as my anchor. however, once moving my X to a much more extreme in price, my convergence at the entry area was still good (4pips), however there were better convergence levels as you can see on the chart…
any thoughts welcome, what would you guys have done on this one? waited for price to go lower or enter at the 100% of CD? i guess cos im on demo i took the 100% and am gonna just watch how this one reacts at the different levels…
cheers
i think i spot a gartley buy pattern forming although it looks like it didnt trigger me in and is heading north!
This has happened to me numerous times before… what you’ll find, however, is that pairs sometimes move in unison with each other. I think its called correlation. But at a given moment, you’ll have all pairs associated with say the JPY moving in the same general direction no matter what the other half is (USD/JPY, GBP/JPY, EUR/JPY, etc). While you did identify a solid looking convergence on the USD/JPY, there was also a convergence on the GBP/JPY that ended up reaching and completing. The chart is posted below so you can take a look.
Keep that in mind, that when you find a pattern on one pair, to look at others associated with it to see if there is anything on them.

racerdude777
Thnx for the input Racer, couldn’t have said it better my self ;).
… Just missed my GBP/USD entry by .5 pips… while analyzing other markets… I need to become my own broker :rolleyes:
Okay chaps (and any chappettes that might be out there  ), here’s a conundrum for you (or maybe it’s not, but it is for me being a newbie lol).
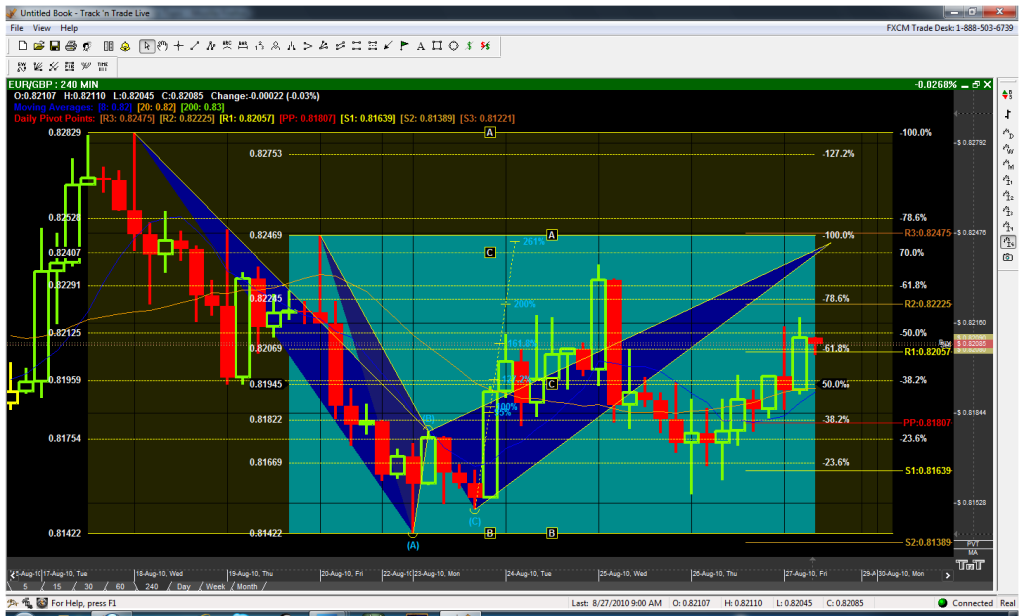
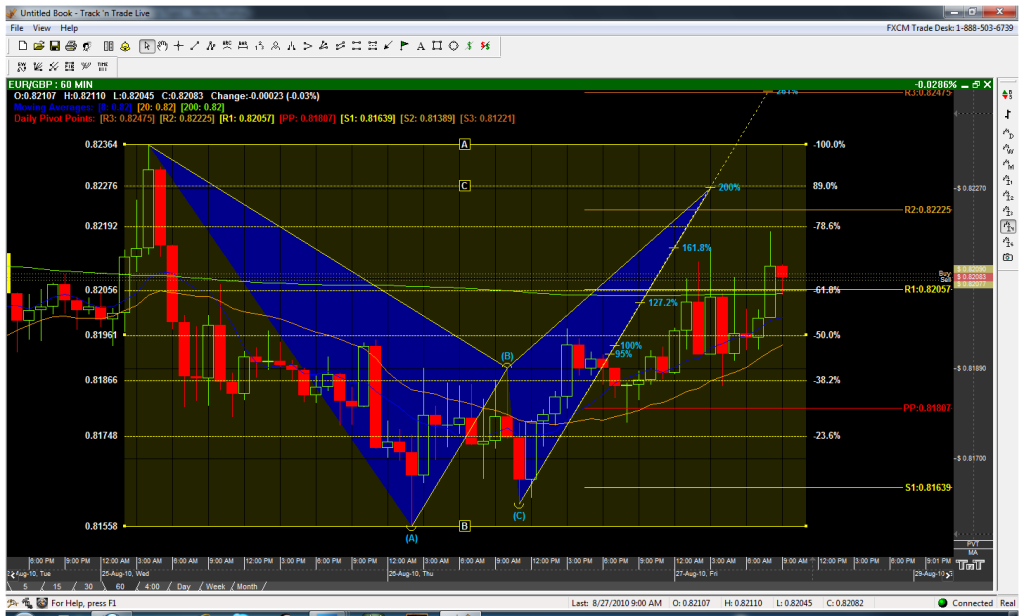
The two charts are EUR/GBP 60min.
On chart 1 we have a bearish Gartley, and it measures up nicely according to Scott Carney’s criteria. The AB leg has retraced 0.618 of XA, and the BC leg has retraced between 0.786 and 0.886 of the AB leg. CD at 1.000 converges nicely with the 0.786 of XA (a difference of 3~4 pips) All in all a nice bearish Gartely.
On chart 2 we have a bearish butterfly, and once again it measures up nicely to fit Scott Carney’s criteria. Here the 1.272 of CD converges to the pip of the XA 1.272.
Now before you all start shouting at me that the X point should be at the extreme (as it is in chart 1), I would like to point out that this X point (chart 2) is a valid up swing top in its own right, and therefore can be used. Any possible X point above this only goes to further compliment the PRZ. If you doubt me, I would refer you to any of Scott Carney’s three books, where you will find plenty of examples of Scott using such points as his X point. Considering Scott Carney’s expertise in this field, I would have no qualms about following his examples.
So my question is this: Which pattern would you trade (if any) and why?
I would love to hear people’s thoughts on this.
TMB, what would your assessment be?
As it happens, price may tumble and render the whole issue academic. Regardless, I think it’s a valid issue, and one I’d love to get feedback on.
Your analysis looks good, unfortunately you are using the wrong swing. Your BC point should range from 8/23 5am - 8/23 5pm (4 hour chart). Also, for this amount of information you should be using the 4 hour chart instead of the 60 min or a mixture of both (You should be able to see a 60 min pattern on a 30 min chart with out having to completely zoom out).
As for using the X you chose for the butterfly, yes it is valid but I would only trade it if that D point also converged with the higher extreme as well unless the fibs price seemed to respect the most where those of the X you have chosen. As a result I will analyze the chart and post it bellow:
Since you where originally analyzing the 60m chart, bellow I have what you should be seeing in your 60/30 min time frame.
TMB
I take on board fully what you say, and I like what I see in your charts. But this just serves to confuse me a little bit more (not hard to do lol).
You say my BC leg is wrongly placed, but looking at examples from Scott Carney’s books I don’t see anything wrong with it. And this is for two reasons:
You also suggest moving the BC leg forward if the CD extends beyond 2.618, however there are patterns (the alternate bat, the crab, and the deep crab) that accommodate an extension greater than 2.618.
Don’t get me wrong, I’m not saying Scott’s word is law, and I certainly am not arguing with you (I can’t afford to, you have your evidence in the bank  ). I merely seek clarification.
Respectfully
An eager and enthusiastic pupil
hi TMB…there is one for ya…why do you open several same possitoins at the same time at the same lot size at your D point?..regards;)
My guess is that if he wants to sell 200 lots on a given pair he could enter in 4 - 50 lot trades, one going to his first TP target, the second going to his next TP target and so on.
Some brokers only allow you to put your TP for the total amount you put it in for, so if his TP was for his first target, then once hit he’s out.
Likewise the other way to do it is to put up a buy at each of your desired TP targets. The problem that could arise with that is if you forget to link the two trades (again depending on how your client works) and your sell hit the SL and then started going the way you predicted, now it’s heading straight for your buy with a horrible chance of hitting it and running straight through, with potentially no stop loss on it. That is if your not sitting there watching it.
Or he could have a complete other reason, that only he secretly knows about that will make him millions of dollors on one trade.
I don’t, its just the stupid brokers that split the lots up when i go past 400 lots from time to time and they do it at random. :mad: