Use the alerts option in MT4 and have it blast one of your favorite WAV files when ever it nears a pre determined price. I am also a fan of alert!fx� - foreign exchange (forex) alerts. which can send a text message to your phone when price hits s predetermined point. With my busy life this is pretty much the only options I have. I have MT4 on my cell phone so I can monitor the trades once they are active.
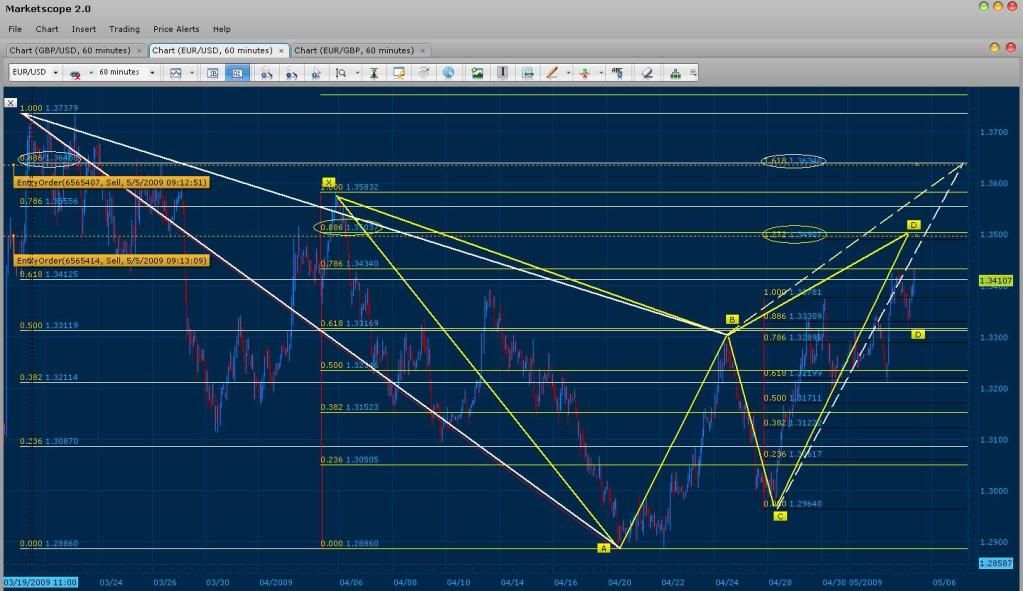
After doing a thorough analysis of the EURO/USD, I have found the reason why price has been moving upward. In fact 2 possible reasons, first we have a Bearish Gartley pattern where the 127% of CD converges with the .886 of XA (Yellow Fibs). Second, we have another Bearish Gartley that converges with 161% of the same CD at the .886 of this XA (White fibs and the most extreme). Both patterns look like great trades, the first one though (yellow) seems to be the one we will be trading today.
BTW Ogna, your pattern is possible. The thing is that it is rare and unlikely to happen, but if price continues to go up from that point and never go bellow A then you have a good chance of it happening.
I have been reviewing the trades that you have listed. More for practical experience than anything. I have been playing with the G/J trade that you have posted and have some qualms about it. Maybe it is my lack of experience teamed with a lack of confidence. I like patterns that seem to “look good” and I guess for me I like to see certain Fib ratios and alignments. I have studied your chart and played with the alignments and feel that this is a trade that I personally would not take. It just doesn’t feel right to me. I know that based on Support and Resistance that if price moves to that point there is likely to be a bounce and then likely a retest down the line. Your pattern would seem to attest to this.
Non the less, until my experience level and more important comfort level with this form of trading increases, patters like this would make me weary. I know that the BC leg is in a strong uptrend which could justify the 38.6 retracement, but again it makes me cautious. Non the less I know that its not like anyone is making me trade this, I just wanted to lay out what I was feeling when I was charting the pattern myself.
Lots of other patterns out there though so I will be following them a little closer.
Your right, in fact non of the Yen pairs seem to be symmetrical do to a lack of a greater retracement then .232 in any instance. Non the less, the pattern is valid. I too feel the same :rolleyes:
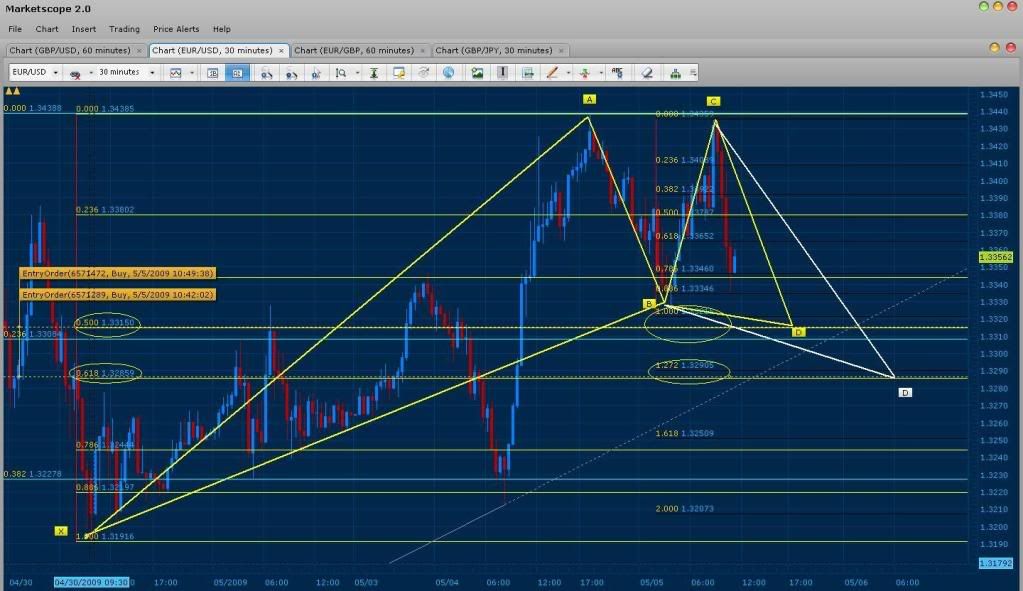
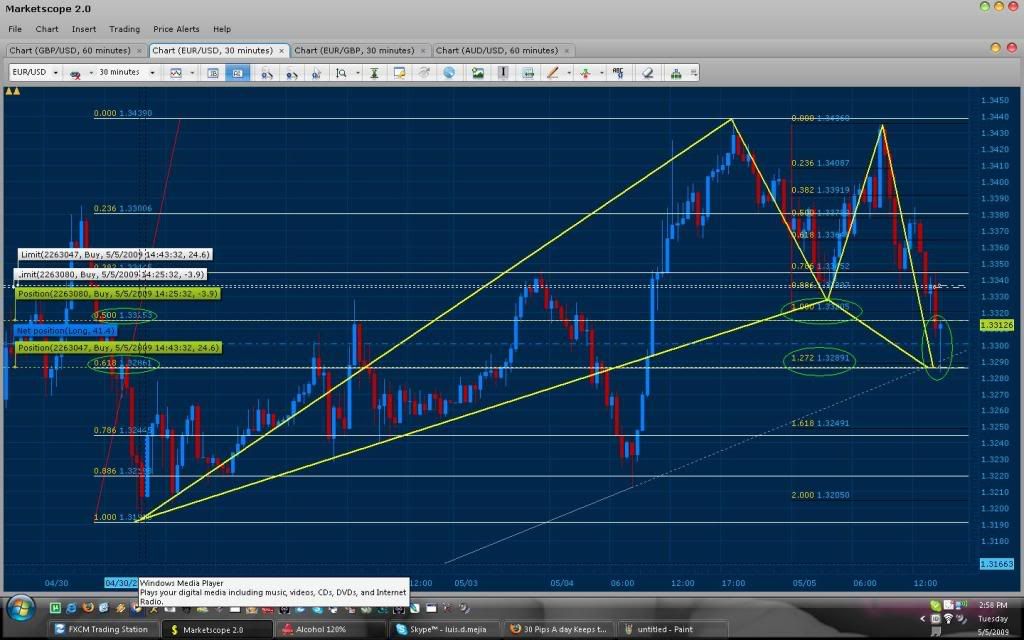
Here is the pattern as promised. In this Bullish Gartley, the 100% of CD converges with the .500 of XA (The same area where we predicted price would go to earlier this morning even though a new CD was formed). In addition, notice that in teal, you see the fibs of the most extreme XA converging at .236 with the .500 of the current XA. Meaning that this is an area of retracement . Also, bellow this convergence area, the 127% of CD converges with the .618 of XA. Leaving room for a second trade if the first one does not go through (note the major trend line bellow it as well):
It looks like most of the pairs are getting ready for big movements towards Dollar strength. This is the reason why we are seeing so many huge patterns in the markets.
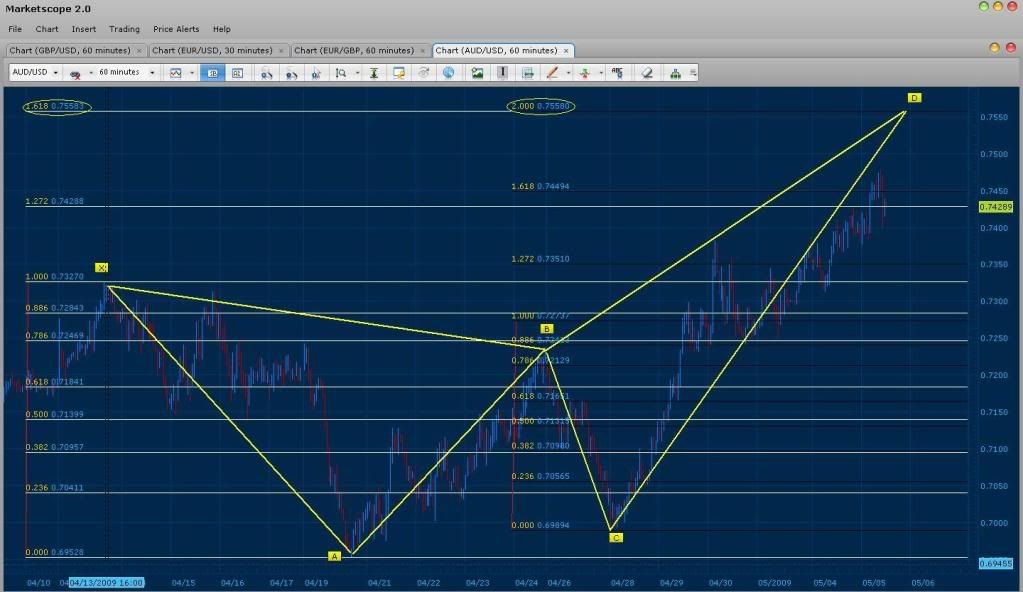
Bellow you will see a Bearish Butterfly where the 200% of CD converges perfectly with the 1.618 of XA.
There are a couple of things to note about this indicator. It seems to pick patterns that look valid, however, they still need to be confirmed with TMB’s method of converging fib lines to get a valid D and/or pattern because sometimes when it displays a pattern, the D hasn’t finished developing, and sometimes the point of reversal just doesn’t conform to the prime fib lines associated with the patterns, and sometimes the patterns just look wacky, but they work…lol.
So I would recommend just playing with it. I believe there is no substitute for manually recognizing valid patterns and I’m concerned this indicator may give one “bad habits” and not develop one’s “feel” for this technique.
Completely agreed. If I download it, I’m going to stick to manually recognizing patterns until I’m good at picking them out on my own. Then I might use the indicator on pairs I don’t trade as much just to keep abreast of their movements. Anyway, thanks!
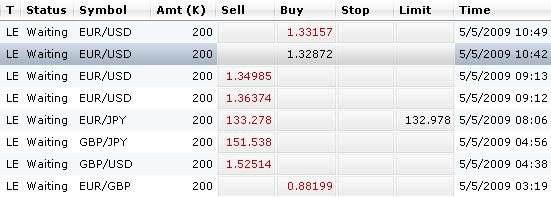
Looks like our Euro/Usd trade just hit the 100% of CD and retraced. It’s still possible for it to fall further down and hit our entry for the buy at 1.33157.
I actually took this trade with a buy entry at 1.3325. Perhaps I was tired of waiting for a trade to enter, but I liked the fact that 50% of XA converged with 100% of the AB leg. It was nice to see price shoot up right at my entry, and I’ve already taken some profit from this trade. But, is this pattern even a valid gartley? The D was pretty much at the same point on the chart as the B and did not exceed it. I don’t remember if the D has to exceed the B, or if they can be at the same point. The chart just doesn’t look right.
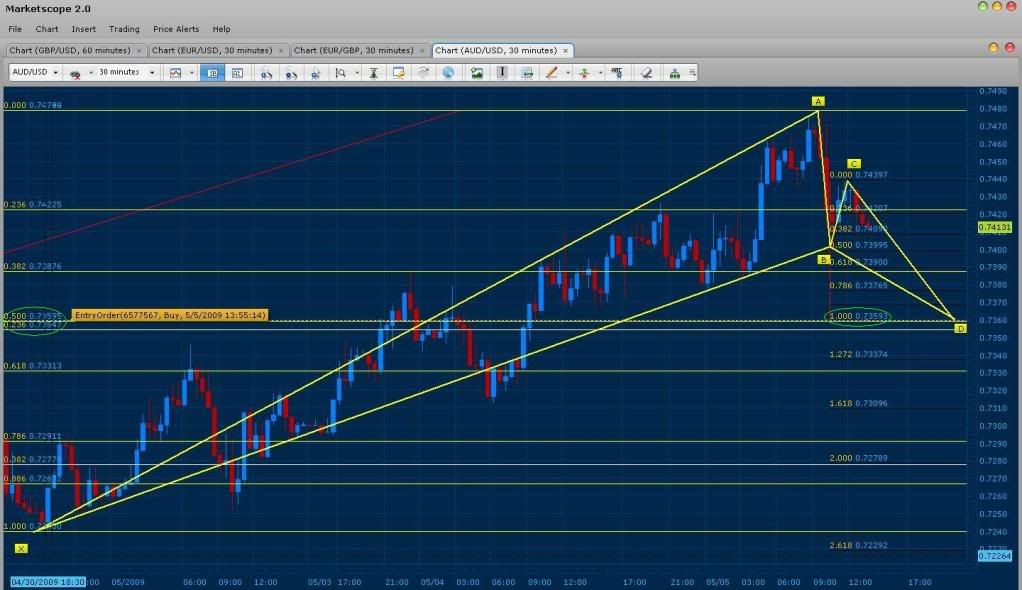
Bellow we have a Possible Bullish Gartley where the 100% of CD convereges with the .500 of XA. The interesting about this pattern is not only that the convergence is perfect, but target 3 of the AD measurement converges with the Butterfly we are expecting to form. As a result, this should be the pattern that gives price “power” to reach our future entry.
Oh, I see, I drew my D at the 100% of CD and you drew yours at the 50% of XA. Do you usually use the XA fib levels for the D? I’ve been splitting the difference lately but made a mistake when I drew this chart up (a positive mistake I guess :D).
Looks Like our buy for the EURO/USD has gone through at both levels. I will now adjust the limits of the 2 trades to add up to 60 pips, which is bellow 30% of its first target at the .618 of AD fibs.