Tmoney how do u find these patterns? Do you use a cell phone alert or are u constantly monitoring the charts?
I explain how to find the patterns on the youtube videos posted earlier on the thread. I’m at the point right now where any group of zig zags whether in Forex, stocks, commodities, in fact any type of chart will pop out the image of a Butterfly or Gartley for me if the measurements are met. It’s not hard to tell the % of retracement in price with just your eye.
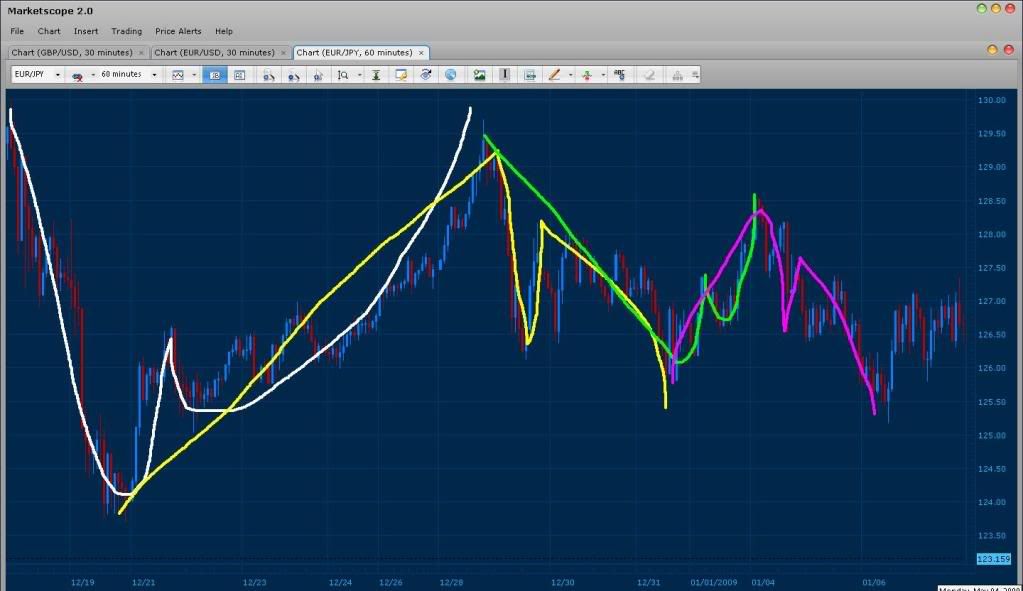
A method I used for learning to find patterns fast in charts was that I would go back in history, take a snap shot of the chart (no matter what time frame, usually the 30 min or 15) and print it out. Then I would look for patterns using the basic rules for establishing the XABCD points. In addition, one thing that I would look for where sloppy W’s and M’s in price. For example see bellow:
TMB,
can you do me a favor and review these for me. Both seem valid to a certain degree.

This was the first one I looked at. The end of point B shows a strong resistance so I wanted to look for additional patterns that might support this one. As i looked I saw this:

Your thoughts and criticism are much appreciated.
thanks for the reply tmb, I was under the impression that these patterns are sort of rare and I was wondering if u used alerts or you patiently waited till the perfect pattern. From your reply Im guessing that they are actually more common then I thought, I have seen your videos and thank you for making them they are very clear and im slowly learning this method. Im actually in the process of buying that book you recommended  regarding the sloppy m’s and w’s what are they exactly for?
The m’s & w’s are the general “look” you are looking for…that’s what the patterns resemble.
The m’s are bullish,
the w’s are bearish.
When you see them, then start measuring them with your fib tool.
If you have mt4 you can use the zigzag indicator too, otherwise just use trendlines to connect swing highs & lows, to help you pick them out visually.

Pretty quiet in here tonight…
Well I’ve been taking a few trades here & there. Saw this nice little channel forming on the eurusd 5M t/f, and using that pattern indicator I found, which displays fib retracements, took shorts at the top of the channel and longs at the bottom. The fibs levels were dead on all the way down. Just took a quick 5-10 pips per trade. 


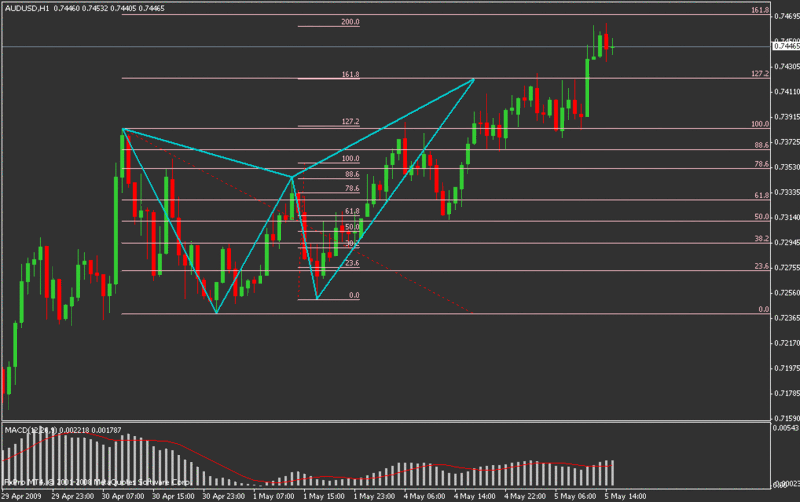
Good patterns, except for the predicted one at 88% of CD… Big nono :eek:. Remember that all D’s form at a minimum of 100% of CD
Good Morning London Session, Sorry for not being up this after noon… (not really  ). I slept extremely well and am ready for trading right now. Feel free to post through out the day, I will be here to answer your questions/doubts. Have a great trading day!
Well, that channel turned into a butterfly…lol
Took the long at 133.52…don’t know if it will make 30 pips, but will put the stop to b/e and let it ride.

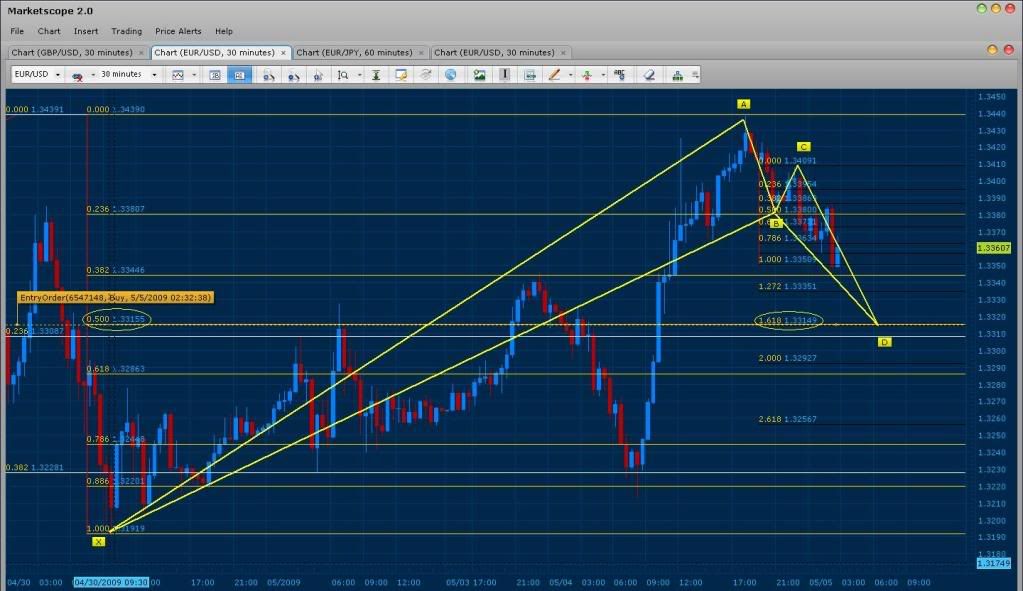
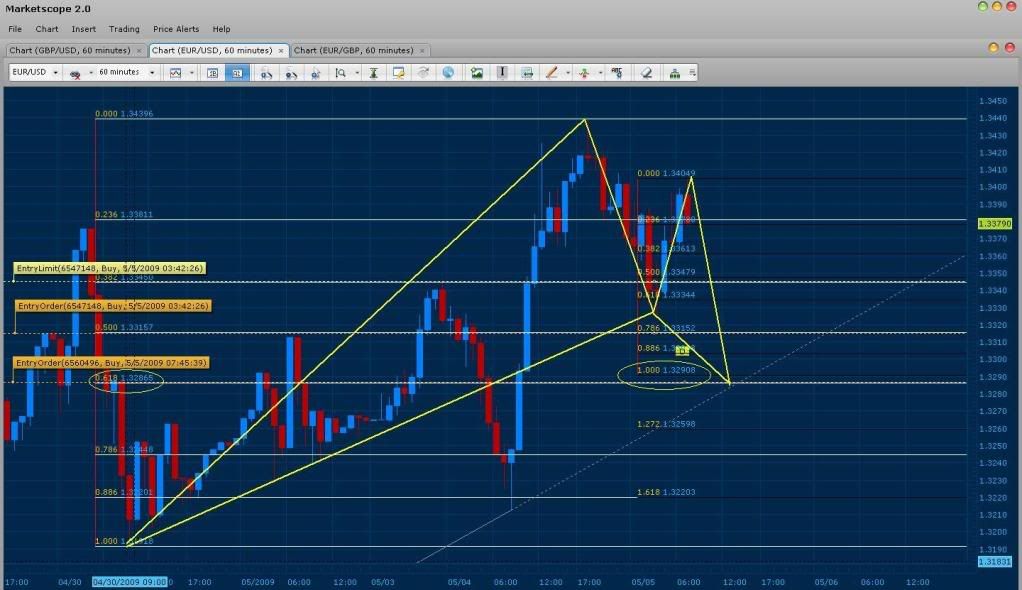
Bellow we have a Bullish Gartley on the EUR/USD 30 min chart. Here you can see that 161% of CD converges perfectly with the .500 of XA. Also, when taking an even greater extreme for X, we notice that it also has some convergence with the .232 of XA. A very good sign that this area of price will be our D. 1.33149 Is where My D is set and your Buy entry should be on that price exactly or a bit above depending on your spread (always take this into account). Thanks sweet pip for pointing out that positive divergence, a good signal as well.
How far back max would you go to get an extreme point that would match a fib convergence of a recent extreme point retrace?..hopefully I said that right…lol
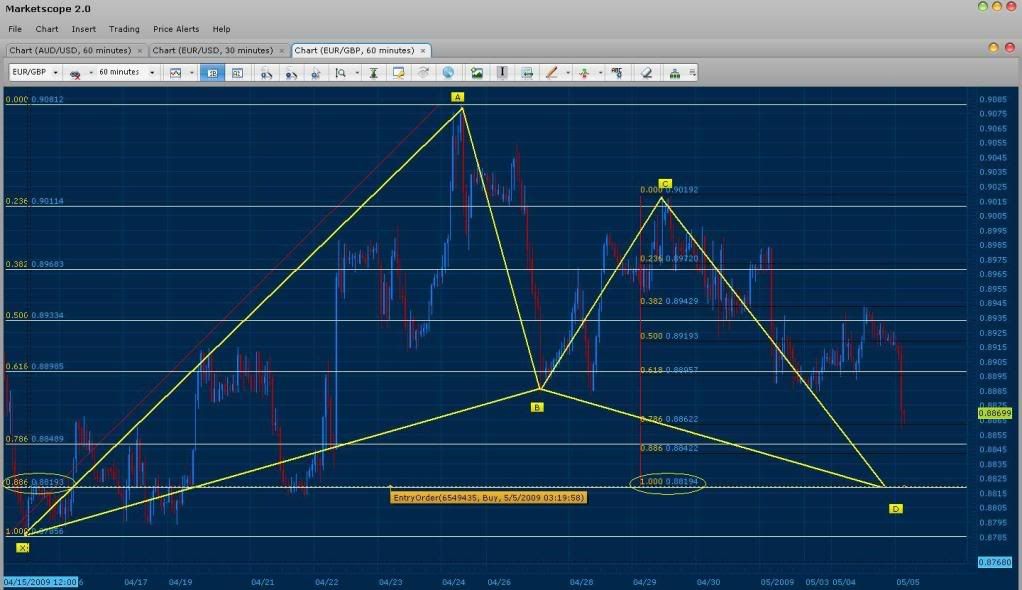
We have a major pattern on the EUR/GBP. It may take some time before it completes but it seems to be symmetrical and shows the reason why the Euro and the Gbp have “separated” from each other and not moving in unison. Once this D is reached the EURO/USD should “shoot up” as well and reach its unison with the GBP. Bellow you will see that the .886 of XA converges perfectly with the 100% of CD.
Missed this post sweet heh, the most extreeme point that matches the current convergence for the EUR/USD is if we put X at the wick of 4/22 3:00 am (60/30 min charts).
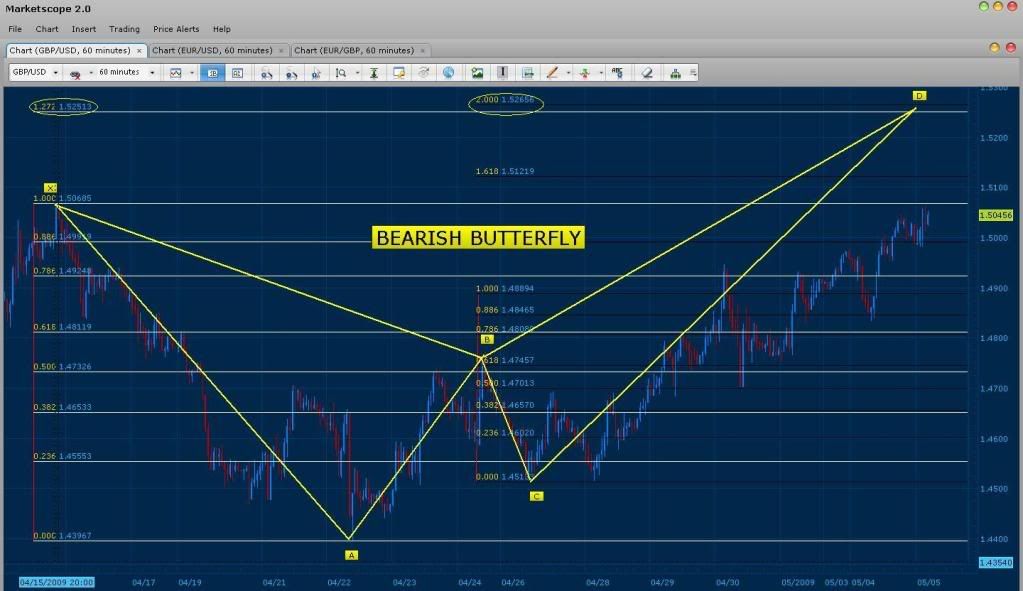
We have a beautiful Bearish Butterfly pattern forming on the GBP/USD. Another pattern that is correlating with the previous predicted patterns for the EURO and GBP pairs. Bellow you will see that the 200% of CD converges with the 1.272 of XA. In addition, their is another CD that i did not draw which converges at 100% and the 1.272 of XA. See bellow:
Hey all,
Some things TMB asked me to post;
GBP/USD sell = 1.52514
EUR/GBP buy = 0.88199
EUR/USD buy = 1.33158
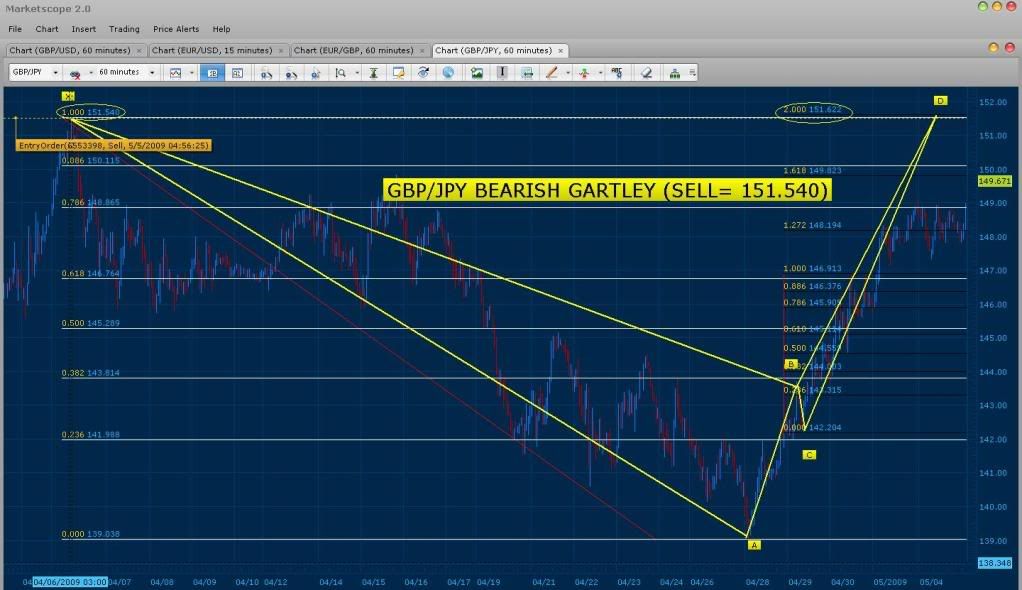
GBP/JPY sell = 151.540 (Rare Bearish Gartley)
We have a major “Rare” pattern developing on the GBP/JPY. It is a Bearish Gartley where 200% of CD converges with the 1.000 fib of XA. See Bellow:
We have a new possible EUR/USD Bullish Gartley forming. It is possible that the previous predicted EUR/USD is a fake out D and this will be our True D. Do to the convergence found on the previous pattern (which is still valid since this C never past the old C) I will keep both entries. Bellow, you will see that 100% of CD converges with the .618 of XA.
Good morning,
How do you choose which area the D will be when there are 2 or more equal convergences?
Cheers
I look for the D with the best possible convergence. In this case, my top down analysis says that the first D I predicted would be the best choice for now. In fact I can even trade both of them and probably take 30 pips. The way the EURO/USD is moving now though, I will have to wait until it forms a more definite BC leg or for price to simply choose a direction and reach its new D or cancel. I am seeing though on the EURO/JPY pair an upcoming Bearish Butterfly Pattern. Meaning that the EURO/USD can continue to climb up before it falls near the area we originally predicted. Now, since today I’ve found more 5+ pattern, I will set these to the side and choose the pair which seems more aesthetically pleasing to me (best symmetry in movement). Which seems to be the GBP/USD and EURO/GBP Patterns.
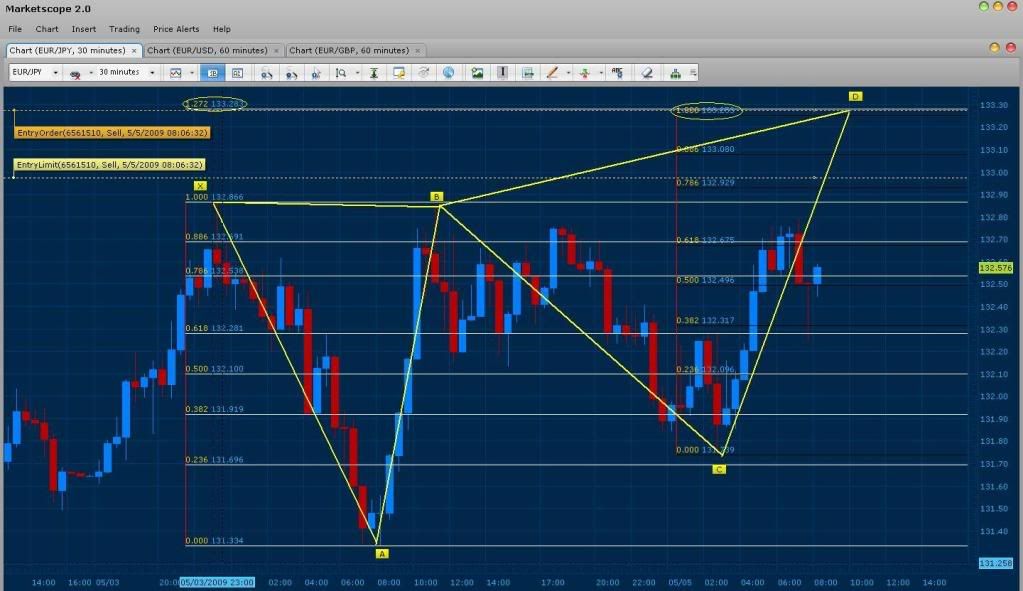
Bellow you will notice a Bearish Butterfly on the EURO/JPY. Here the 100% of CD converges with the 1.272 of XA.
Good patterns TMB. I put in a few orders after charting some of them. What I like to do when you put up a chart, is take a quick glance at the pair you’re using, then close it and open up my charting system. I’ll then chart it myself and see if I can come up with the same thing. That might be a good idea for anyone wanting to really learn this method and get the hands on experience.
Anyway, I’m always drawing these patterns now. I need to get more organized though, cause today I woke up with a perfect 30 pip setup that I forgot to trade! I had the chart all drawn up, I just forgot to look back at it when the pattern was nearing completion.
Hey Sweet Pip -
Do you remember where you got that fib indicator for MT4?