hi all… last one for this week…i took a small loss earlier on this pattern but made it back fast …one mistake i made… .i entered a bit late and it cost me around 10 pips and it made me nervous because i had to put wider SL…
ALLWAYS set you price alarms!
happy weekend to all …
By radofx at 2010-10-29
here is something from Jesse Livermore himself
‘All through time, people have basically acted and reacted the same way in the market as a result of: greed, fear, ignorance, and hope. That is why the numerical formations and patterns recur on a constant basis.’
’
‘The game of speculation is the most uniformly fascinating game in the world. But it is not a game for the stupid, the mentally lazy, the person of inferior emotional balance, or the get-rich-quick adventurer. They will die poor.’
I agree, gotta give it some time. I’ve been watching that AB=CD form on the daily for a while now. I’m in bearish pattern mode and as I see there’s been some great profitable patterns lately. Thanks for your help. Keep up the great finds guys!
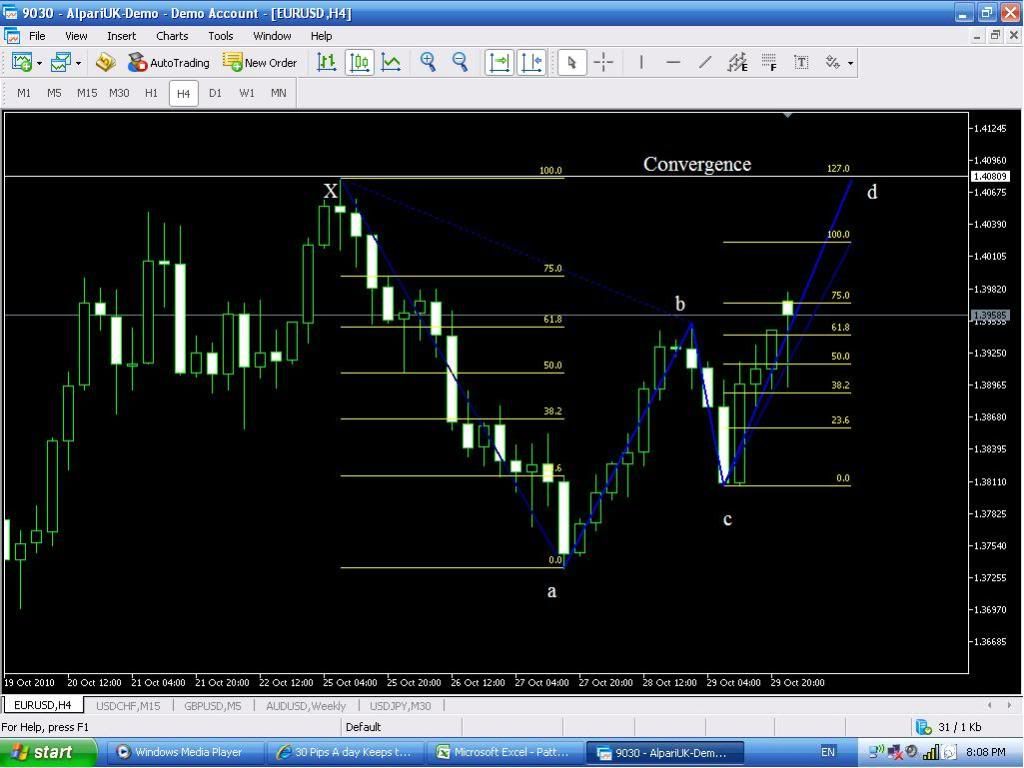
There is a bearish Gartley forming on the EURUSD H4 with very nice convergence. I believe this is usually referred to as a rare but valid pattern. The 1.0 fib level of XA converges with the 127 fib level of AB. Concerning time the BC leg was aprox. .382 of AB. AB was also a .5 of the time of XA. Price action shows that CD may be a 1:1 ratio of AB’s time.
Convergence occurs within 1.5 pip range at 1.4080. I think this is a definite trade. I will be using a tight stop however because of the fear of Fed QE2. Anyone have any opinions on the validity of Gartley after full retracement of the XA leg?
I believe it would actually make it a stonger reversal zone since its a double top. But thats just my opinion. Draw a fib from B to C. You will notice that that the 2.00 also convergences at the 1.00XA.
I would think so too. I have read that a 1.0 XA retracement pattern has a lower success rate, but that doesn’t mean that it won’t provide enough resistance for a quick 30 pips.
HI pbylina! yeah i had this position set up since friday afternoon…one of the rare times i keep a trade during the weekend…took 53 pips out of it…didnt like it waiting for 2 days :rolleyes:
Heads up - Bullish Gartley forming on 15m EURUSD chart. I will be on my phone today (on the road) so this will probably be all I trade today. I expect the 4h pattern posted ealier to complete so EURUSD will likely move down to convergence on the 15m pattern, which I mark at 1.3909 and then bullish sentiment will take it up to 1.4078.
This is all partially dependent on the new releases coming out this morning of course. GL all!
15 m Eurusd order never got triggered for me on live (did on demo however). I set order 4 pips away from convergence but perhaps that is too close still. Anyway, price has already moved up past 30 pips. Congrats to anyone who caught the move. Ill be watching for a bearish pattern that coinsides with the one on the 4h chart.
How do you factor in price spikes like the one we just saw in the USDJPY regarding patterns, I know that price spikes either way can sometimes lead to the “D” but what if it is in the middle of the pattern on a different leg, do you dismiss it as an anomaly or move to a different pair? thanks
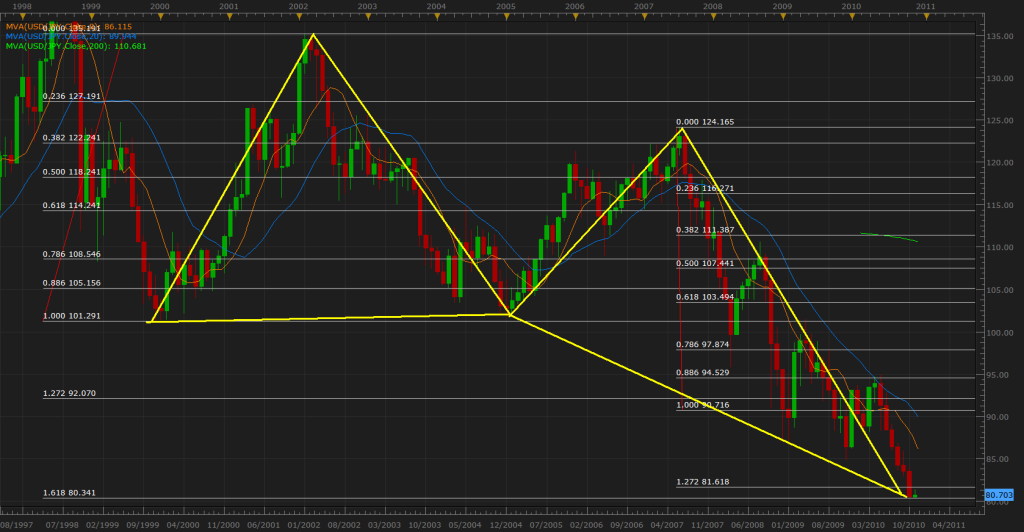
I’ve stated many times through out this thread that when things do not make sense in the lower time frames you must move to the higher time frames for the answer. As you all know, price has not been near these levels in years for the USD/JPY and as a result we should expect excruciating tests of the markets such as these spikes to happen. Non the less, when “phenomenons” like these spikes occur their is for the most part a technical reason for it and bellow you will see exactly why price spiked on this pair.
Bellow we have a beautiful bullish butter fly pattern on the monthly of this pair and if we look closely at the chart the pattern before it had given a 1500+ pip move before continuing down to the next convergence point. Here we see that the 1.618 of XA converges with the 127% of CD. Again, please note that price respected the first D prior to this at 1.272 of XA and 100% CD. This is important because we have price history indicating to us that these fibs are indeed valid and as it did before it may very well hold up price for a few months and unless this level is broken it has a 70% chance of retracing to the .618 of AD.
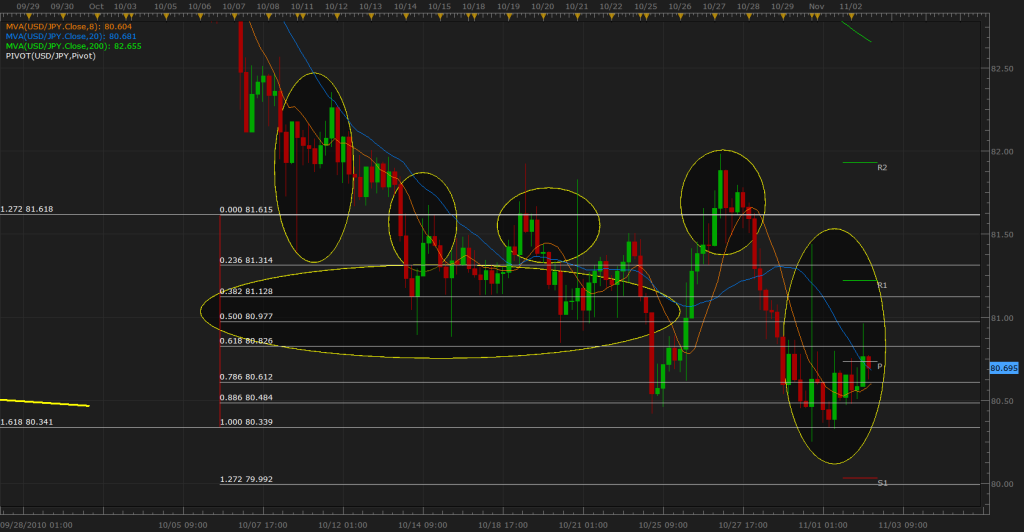
Please take your time when looking at the image bellow. The circles show that price has been respecting the monthly fibs on the 4 hour chart. This is significant because now we know that price truly respects these levels and the 4 hour closes and spikes are proof towards this. Also, I have measured the distance between the convergence with the Fibonacci tool the same way I would measure the movement of a leg (from the 1.618 of XA to the 127% CD). I have done this so that you can see that within the convergence price is respecting the fib levels and it bounced initially at the 50% of the convergence which also acted as a strong support line for a few days before reaching the 1.618 of XA. This is the reason why at times I place my entries in between the convergence point and not exactly on the fib point it self. This is especially true when it comes to higher patterns such as these.
Now we are at the 30 min chart using the the same Monthly fib convergence points. Here you will note that price broke through the 1.618 of XA but immediately came back inside after the retest before the spike occurred. Because of such fake outs, is the reason why you must use the close of the higher time frames to judge the validity of patterns of this magnitude (4hr, daily, monthly close). Ultimately the monthly close of price will indicate if the pattern will be respected, but the 4 hour and the daily closes will most definitely add weight to this and hint towards what will happen. All in all last months close didn’t even hit the target point and as soon as it did price began to spike and respect the levels as you have seen on the illustrations.
As a result, be on the look out for buy patterns on this pair and for dollar strength in general through out all the markets between now and the first quarter of 2011. As Always, do not fall in love with this trade simply because it is a monthly pattern. Patterns are not a 100% guaranteed win and a failure of this one will move just as harsh downwards as it could on the up direction.
*Note.: to get the exact fibs levels on the lower time frames when using the Market scope platform you must manually adjust the fibs of the highs and lows when measuring your XA and CD% (CD; before placing the 0.00 on the tip of C). You do this by double clicking your fibs and selecting “trendline”(top right tab in the properties) and changing the starting and ending rate.
*Note.: In effect the 1.0 of XA must be 101.291 and 0.000 is 135.191. When drawing CD % 0.00 must be 135.191 and the 1.00 on the top of B must be 101.679. Then when moving the 0.00 to the top of C it should be as close to 124.161 as possible (mine is at 124.165).
To avoid having to do things like this you can use Platforms such as Track ‘N’ Trade which snap the fibs to the exact wicks of price. I personally don’t mind the work heh, because patterns like these are extremely rare.
Hello, i’m a newbie trader here just reading up and quite definitive interested in this. I picked out the “Trade what you see” and just started on the first few chapters.
I posted this since I see what could be a pattern of some sorts in the EUR/USD[[and a pattern before it beforehand] That’s been matching the 1 hour up to 4 hour or so [give or take]
The markings brewed from practicing harmonics from the first few chapters so dont know if theyre right or wrong but wanted to show the community it just in case.


 I’m in bearish pattern mode and as I see there’s been some great profitable patterns lately. Thanks for your help. Keep up the great finds guys!