Ouch yeah man, I got scared of the EUR/GBP even though it never closed bellow my entry point :mad: and only made 10 pips. heh I’m human though :rolleyes:
Hey TmB I’m looking at AUD/USD and I see a gartley but the D is all the way at X Im not really familiar with Butterflys so I would like to know which pattern I drew here is correct.
Thanks 

The second one, but If you notice, your X is actually a D pattern that hasn’t failed yet and at a major Fib point of the daily .382. So keep in mind that a pattern “fails” when price closes past the D point (which it hasn’t done yet), meaning that its power is still “active”. In addition, the gap that was made in the market on Sunday has not been “filled yet”. So this pattern could still push price down to that point and cancel the movement up as just speculation from the news that came out. Also Note that a market will NEVER leave a gap in the market and price will always come back and test it. In forex, we have an entire week for price to fill that gap unlike stocks where markets are closed daily. At 5/3 16:30 is the gap (on market scope you will see this as a bar where price never came back to test when the market opened).
Ok thanks, by second one you mean the gartley or butterfly? hehe:D
I was back and forth with the EG trade, but closed the order right before going to bed. It would have been nice to wake up to a winner, but being new to this, I really think it helps me a lot to keep seeing successful trades. Someday I’ll get over my trust issues!
Trust issue = a fear issue. That’s human psychology. Fear over takes greed generally; example we can all relate to: "everything is set up perfect for a trade. There is a nice pattern, stoc and macd are pointing that price is about to go our way, and we place our order at what we think is the best possible entry. Then… WTF… price drops 10 pips against us. Here comes the flood of questions and 2nd thoughts. Did I miss something? Was my analysis wrong? Price lingers at this -10 pips and finally we cant take it anymore. We close out the trade… wait… omg… price shoots up 100 pips… "
lol that may be slightly exaggerated but we have all been there. Our fear smacked our greed down and we only felt the pain of loss. So with that said maybe the approach to trading the pattern needs to be met in a manner that makes our psychology somewhat in tune with it. The only thing that I can think of that makes me feel somewhat confident in the pattern is that if you trade GOOD PATTERNS you will win 70% of the time. Almost 3 out of 4 will be winners. Wow!
another important thing when trading is not only to learn about the trades by the results… but also learn about ourselves from the results. Easier said than done I know. I wish I had more time to talk about this stuff because I enjoy it… but alas I must go.
Cheers and good trading to all.
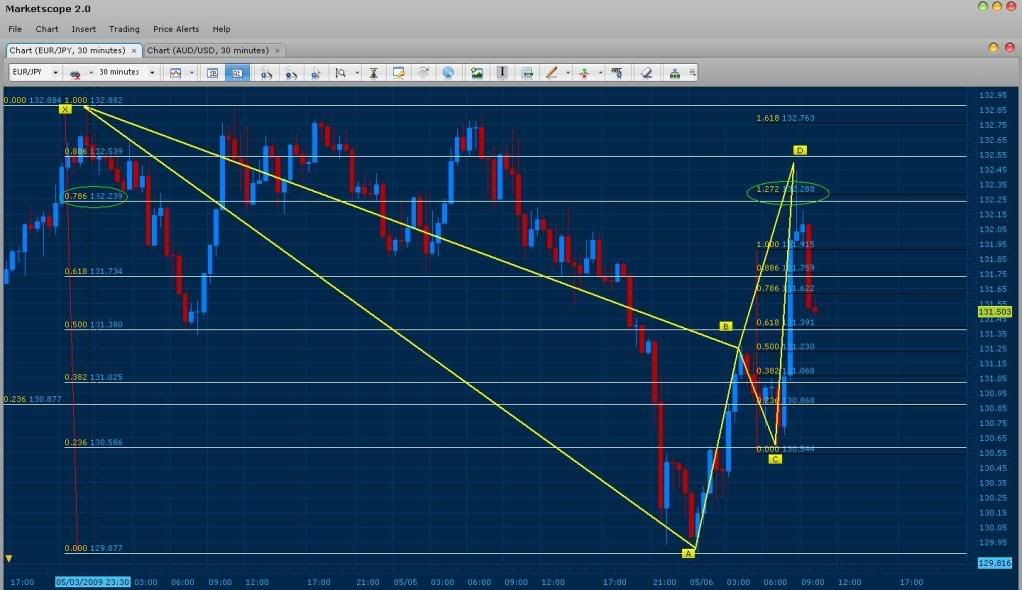
I am dumbfounded by the fact that I disregarded my rules and closed the EUR/GBP for just 10 pips when it had a potential 140 pips (Target 1). Another thing that went wrong for the trading day, was that I had left over 10 entries for patterns I was waiting for on standby. This is a big mistake and caused me to manage 2 negative trades on the AUS/USD and the EURO/JPY. I admit, I was c0cky and thought that it wouldn’t matter to keep these entries in like that… WRONG! Heh, another beginners mistake. The good news is that I was able to identify my mistakes, closed out all my entries and focus on finding a solution for the problem. In effect I found a pattern confirming that a new D on the EURO/JPY that could at least close us out even around 50 pips and still 30 % away from target 1 and noticed that the AUD/USD was in a major resistance area that would cause a turn around in the market. These where all signals saying that the market had moved up do to speculation from the news that came out. In addition, shooting stars had appeared at the convergence area giving further confirmation. As a result, we where able to meet the 30 pip goal for the day (33 pips total). We will be ending our trading for the day, but I will be available for questions and responses until 7pm est (my new sleeping hour). Remember, there is always an escape! :rolleyes:
Completed Trades:
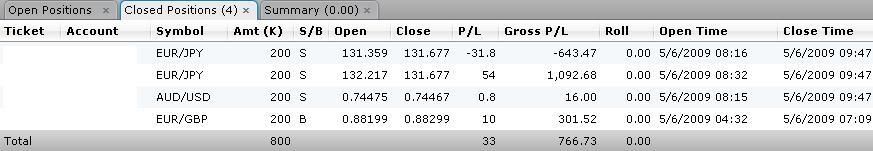
“Escape Pattern” (EURO/JPY Bearish Gartley; Convergence of XA .786 and 127% of CD; Identifying the move up as a fake out):
It’s time to open up “The Disciplined Trader” book again heh and refresh my mind about trading psychology.
okay im confused… I thought I did well with 61 pips… I just dont see how you were seeing 120 pips out of the eg move. Did you mean the EJ pair that you posted?
Yeah your right lol I must have been a typo :P.
Target 1 on that pattern is around 140 pips (still valid).
Good Morning All,
Hi Tmoney, I am not overlooking your previous Eur/us analysis, just looking at a smaller developing pattern. Can you please confirm as something that could be valid?
Thanks

Bank your pattern looks good I drew it on my charts too 
I was just about to stop looking for patterns because I couldn’t find any lol
Thanks
Thanks Ogna, waiting to see how it plays out!


woah yea next time I get discouraged I’m coming to you LOL
Lava,
Would you more inclined to take only the more symmetrical set ups on these? Also, how much do you change your TP by when trading on the 15 min as opposed to the 1 hour? Thanks!
Hey hoss,
Yes, I would definitely be more inclined to take only the more symmetrical setups. But I don’t mind if the XA is much longer than the AB, especially if there is an AB=CD pattern in there. I would say I’m only trading about one out of five patterns I draw.
I’ve been using a risk management system that was written about in “Trade What You SEE”. That is, for now I set my stop at a spot that will be difficult to hit, usually right under or over some major resistance or the next major fib level. I then take half my profits when price hits a level equal to the amount I had at risk. Then, I take the rest of the profit at the next major support/resistance or fib level, whichever seems to make more sense. Typically, my stops have been around 25-35 pips, and my final TPs have been around 35-55 pips. Yes, these are usually at the lower end on 15 minute charts and the higher end on hourly charts.
I’m just as new to this as most others on this thread. So I’m still experimenting to see what works for me. Right now my account level is exactly where it was when I started trading these patterns. So, considering all my rookie mistakes, I feel pretty good about that!
Hi Lavaman, I am not quiet sure I would say that 15Min patterns are at the lower end. I personally search for patterns on 1hr to 15M but primarily trade 15M. What I have found is that patterns will develop on the 15M that work toward achieving one hour setups and so on.
Bank
That’s true, most of the time you will find 1-3 patterns that lead to the 30/60 min patterns. If you want to find a limit that would work in any given time frame just about 85-90% of the time, I would set my limit at the .382 of the CD fib measurement (Conservative). Another option which works as well is the .382 of the AD leg (less Conservative). This is because of the fact that usually when a pattern such as a Gartley fails, it retraces to the .382 of AD (testing price) before it fails. Also take note that its roughly 50% of a patterns target 1 which is typically the .618 of AD. Also, a good tactic that works (if you have the discipline to follow it). Is to set your stop as a free trade once it hits the .236 of your XA. I’ve found that when 8/10 times when a pattern fails it will reach the .236 measurement of AD (wick to wick) and then fail. An even more conservative way to set a stop or limit with this method is draw your fibs from the Base price of A to the wick of D. Go back through your charts and put the theaory to the test. Its real and it works, Again I highly stress that you must be disciplined to follow methods such as this.
Hey Bank,
You’re right about M15 patterns developing into good trades on the hour charts sometimes. I’m not talking about major differences here. I just mean that I think my typical risk on the 15 minute charts is about 25 pips, whereas on the hour charts 35 pips might be more typical. To demonstrate, I was getting a bit restless today so I zoomed into the five minute charts on the EU. I don’t usually go timeframes this low but I still took the trade. Since I was only going for about 20-30 pips, I didn’t want to risk that much and set my stop for 15 pips. I would never set a stop that close on the hourly charts. Got a nice bounce on this one…