Price Labels show entry and exit. There is a smaller bearish Gartley that game me reason to enter (the fibs were removed for the entry.) I set my stop and went to grab a drink. When I walked back to my computer I about choked as I saw the massive downbar. I had actually been counting on the Bearish pattern that is shown to be the main trade! I exited at a fair price making a good and quick number of pips. I re-entered at the bullish convergence as it came back down to it with a VERY small risk. That huge down bar just made me think there was more downward movement to come.
I think that as part of a trading plan you could make a rule NOT to take midpoint x’s, therefore avoiding the temptation to overtrade, i’m thinking about making that a rule in my trading plan.
But i first want to know if any of you have found it rather profitable by trading patterns with X at a midpoint, (a slight reversal so that an X may be identified)
I hope that made sense, waiting for an answer thanks!!!
Here’s a pattern I am looking at (Counter Trend) Because it is counter trend, my T/P (If price action confirms) will be placed closer to point D, that is, 0.382, and 0.5 retracement points. See Full Size Image
skratch,
what do you mean by having the X at midpoint?
For the PRZ for the CAD/JPY pattern, where would you specifically place your entry or would you decide depending on candles?
Here’s my example, see how a pattern may be identified if you take a slight reversal on a longer leg, I read somewhere that you could do that too but I’m having trouble I think I will stop taking patterns like that…
I wait for price action, a double top, head and shoulders, three mountain top, some sort of price pattern in the short term (30 min or 15 min) since I concentrate on long term pattern identification (4h-daily) etc. anything to show downward movement in the PRZ… sometimes these 2618’s show up:
When I first read about all these price action hints like head and shoulders i took it lightly like yeah right… but they really do show up and i’m realizing that now.
The thing about this strategy is that is can be somewhat subjective from time to time even when you are following the rules to a tee. By choosing to use a midpoint X then you have moved much more away from an objective trade to an almost purely subjective trade. By always using the extreme high or low as your anchor point or X you reduce the chance of psychologically “making the trade look like you want it to” and failing.
Remember this strategy is a probabilities game. Trading X pattern, when the rules are followed, gives a x% chance of succeeding.
EDIT:
After re-looking at your previous post I noticed that the CD leg is not equal to the AB leg. Sure, it was a reversal zone but was not actually a pattern.
back from holiday, hope everyone is well. there hasnt been much pattern posting, here’s one i found on the 4hr gbp/jpy chart let me know your thoughts on it.
Hello guys!!! Long time :), I’ve been perfecting the trading system and am ready to share my new found knowledge. In addition I would like you all to note that this is all in preparation for the seminars that I will be giving live in November and December this year. In short, starting 8/15/2012 - 11/1/2012 I will be posting my market analysis and entries on this thread. Enjoy the freebies and feel free to ask questions I have not answered already on this thread (it is up to you to do your due diligence on what ever is needed to survive in the trading world… and I know that a wealth of knowledge from my part has already been shared to the public… do your research) and enjoy the soon to come freebies ;).
Good morning guys!!! Long time no talk, I’m going to keep this first post short and simple so you guys can ask me all the questions you want from the image you see bellow:
I’m currently trading from C to D using an hourly break above 80.917 as my exit (this is because apart from it being a major support/resistance zone in the past, it also converges with the .236 of my XA). I will exit the short by going long at 80.558 with half of my maximum lots and another long entry will be waiting for me around 80.443, a 30 min or hourly break bellow 80.396 will be my exit for these long positions.
well if we take the current position, a flag broke towards the south with an apex landing it around 127% CD. In addition, we are at the top of a major horizontal channel which verifies the sell towards c to d. Also if you look at the picture, I have to swings measured for the D points… a break of these points indicates a failure of the C to D trade, a break above the level i mentioned (the green horizontal line) is a warning for the break of these swings. In other words, go back to the basics and apply your current knowledge… people still trade the breaks of trendlines, triangles, slopes, etc… add the basics to harmonics and you can trade anything ;).
Woops… seems like I missed an important part of the puzzle .
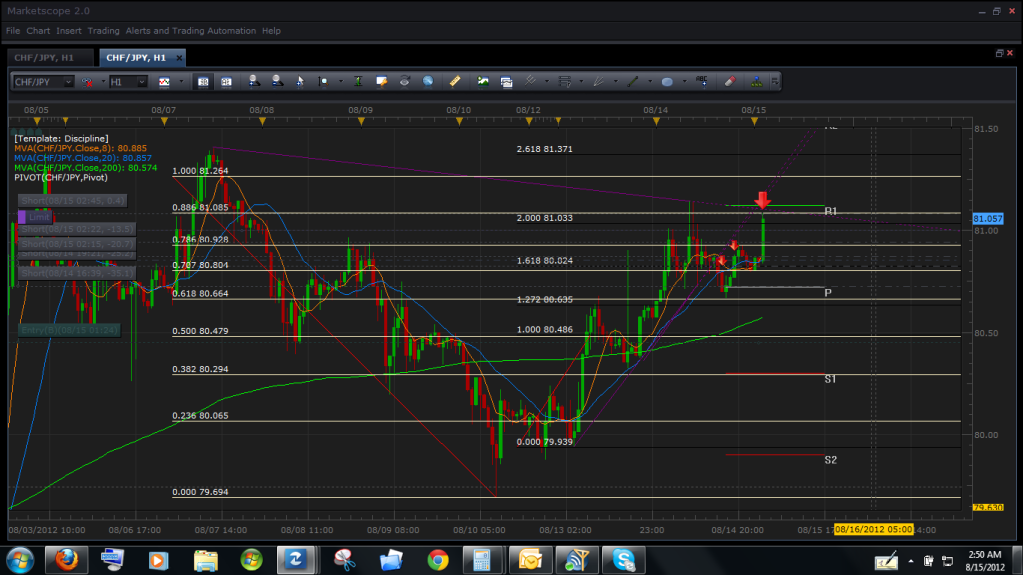
I forgot to draw the pattern which triggered the original sell on the CHF/JPY. In other words, I will now be turning my original sell into a Hydra and using the .886 and 200% CD you see bellow as my exit. The target for the trade stays the same, even though it is now projected to reach 80.00.
Thanks for replying. I have that drawn on my charts now. So now the stop loss procedure is to close if the 1 hr bar closes past the bid price of 81.02?
Please comment on this, I want to know if I have this concept right. Originally, you were targeting the approx 38.2% of AD and planning to go long after that. You wanted to go long because the wick touched the convergence point but there was never a close of 1 hr bar near it. Now that we have a 1 hr bar testing and respecting the convergence zone 81.02-81.038, we can expect the trade to fully bounce (maybe 50% XA) and possible be a reversal, hence why your new target is 80.0?
81.085 to be exact, once this breaks price will easily push towards 81.264 and if that point breaks as well then the true D point will be triggered at 81.649


 sometimes these 2618’s show up:

 Enjoy the freebies and feel free to ask questions I have not answered already on this thread (it is up to you to do your due diligence on what ever is needed to survive in the trading world… and I know that a wealth of knowledge from my part has already been shared to the public… do your research) and enjoy the soon to come freebies ;).
 Long time no talk, I’m going to keep this first post short and simple so you guys can ask me all the questions you want from the image you see bellow:
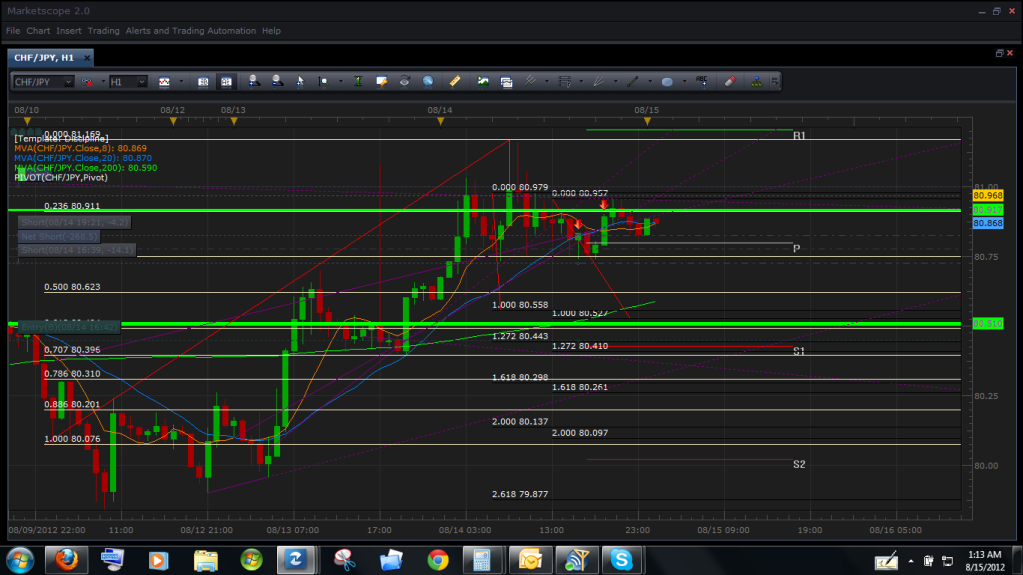
 .
.