Hate to bombard you with questions, but I have just one more.
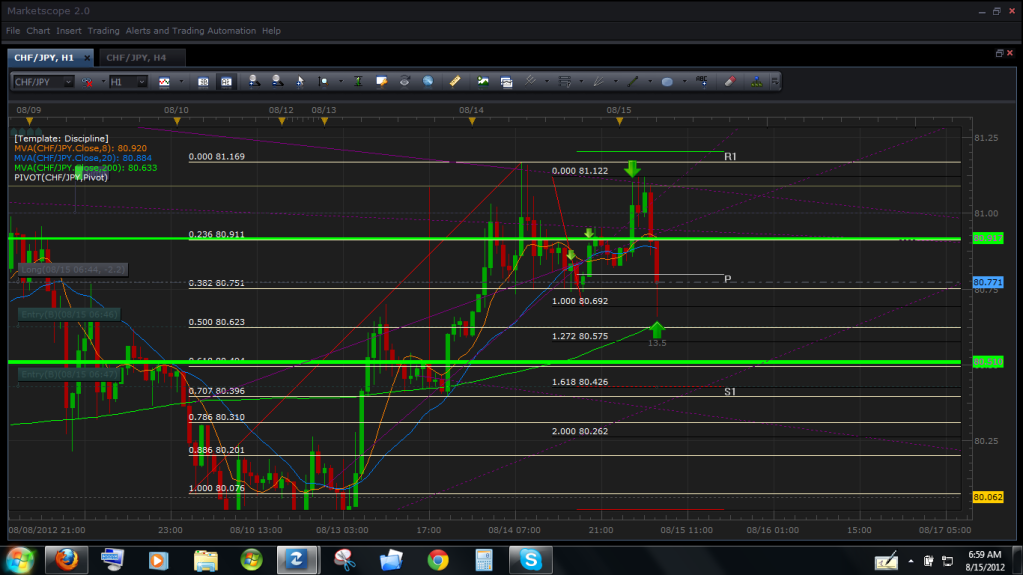
My X is at 81.40, A is at 79.7, my convergence I see is the 78.6/200, is that correct? You state the 88.6, which is way up at 81.21
Hate to bombard you with questions, but I have just one more.
My X is at 81.40, A is at 79.7, my convergence I see is the 78.6/200, is that correct? You state the 88.6, which is way up at 81.21
The projection towards 80.0 is simple… I see this current retest not only as the test of the D point but also as the retest of an ascending triangle with a projection of 103 pips. This projection places price around the 80.0 lvl and if you place a horizontal line in that point, you will notice that for the past 30 days more the 35 four hour candles have touched that zone. In addition, If this final sell point where to work then it will be considered a BC leg and the 261% CD will reach .80. My limit and buy is around the .85 area because price must break this major support zone before continuing and a pattern will develop around that zone regardless… Giving me a tight stop and reversal point towards .80 just in case that buy where to fail.
Well im relieved that 1 hr bar closed where we wanted it too.
Thanks for the help!
Take a closer look at the image I posted… my X is clearly shown there with the fibs at 81.264
glad you guys are back, the thread went dead for a while so I went off to study other chart patterns, now I try to use these patterns in combination with Head and Shoulders, wedges, 26-18’s, trendlines, etc. it’s gotten pretty exciting haha.
I’ll still be following along ^^ cheers
hi, why X is at 81.264? I thought X should be the highest or lower btw that time zone?
Thats exactly how this system should be used  another powerful tool in the belt… never stop learning!
So is that convergence on chfjpy considered broke by the last bar? Should it be exited?
The previous bar (1hr/4hr) never closed above 81.085 which is my .886.
Because of the current market reaction (price just created a 10 pip wick confirming this) I have decided to withdraw from the short and create a hydra towards the 4 hour pattern at 81.645. Bellow you will note that my entries for the hydra is spread between the 100% , 127% and 161% CD; ultimately using the convergence between .707XA and 161% CD as my exit and reversal in market direction (if such a break occurs I will reverse my positions towards 80.082).
Louis,
Are you profitable?
I should probably know this but i cant seem to find any information on it anywhere, is a Hydra a chart pattern? TMB could you please indicate what the exact value of your C point is, from your first new post, im trying to draw it just like you have it on there but am confused about where you projected your fibs from cuz I can’t find a good C… I believe your B was at 50%? so was this pattern a bat??
THank you!!!
Ok, dont know if Im missing something really stupid here. But why do you have your X 1.0 at 80.076. I always put mine at the swing hi/lo. In this case I have it at the low at 79.71 (ask).
Like I said, study the charts I have posted… the answer is right in front of your eyes. It is part of the new technique :27:
The low of 8/14 17:00 (80.668) is my B and C is the high of 8/15 4am (81.105). This is for the Long Hydra towards the sell at 81.692.
TMB do you by any chance have a link towards a picture that demonstrates what a hydra looks like? is it a pattern or a strategy that can be visually depicted??
thank you!
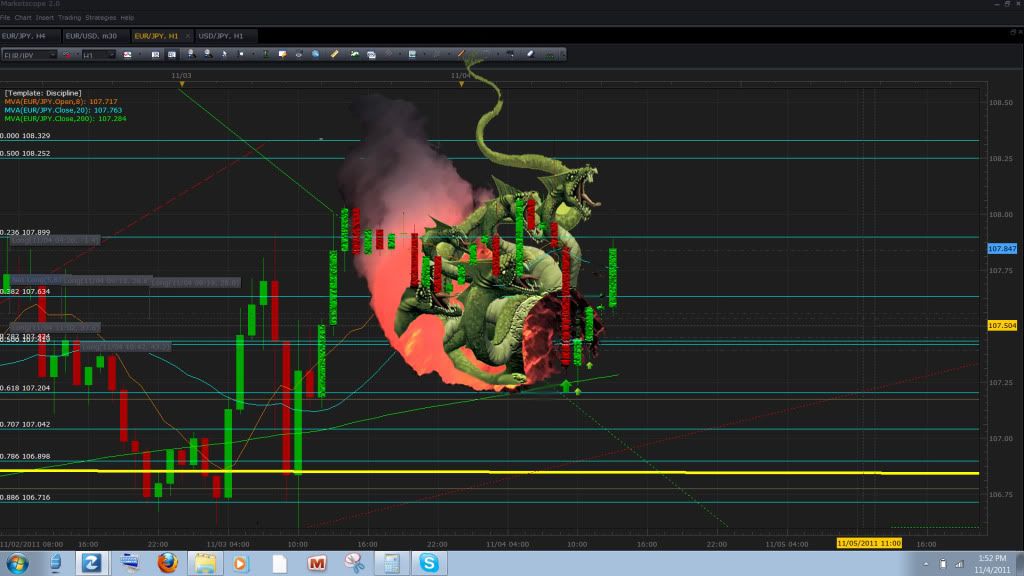
A hydra is a beast from roman/greek mythology that grows an extra head for each one that’s chopped off… in the trading world a hydra are multiple positions spread across resistance zones growing in strength in both lot size and support/resistance.
haha thank you! i suppose it’s also used to lower avg cost
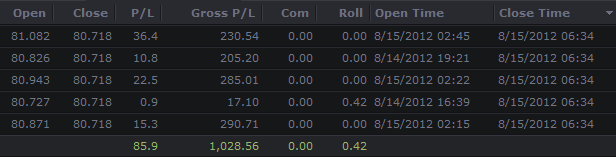
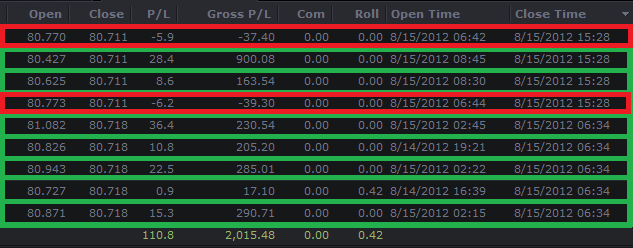
Profit 08/15/2012 complete:
Even though I see the CHF/JPY reaching the target i mentioned earlier, I prefer to take a rest and wait for the development of this evening or tomorrow morning to continue trading. Thank you all for keeping this thread alive even with my absence :).