increible! todos en CHF/JPY? i look forward to your posts as I can see that you have completely perfected this approach… thank YOU for the thread and nice job today 
TMB, seriously, dont you plan to write a book or an ebook or something ?
is your X at the low of 8 EMA on a bull pattern and at the high of the EMA before it starts to turn downwards on a bear pattern?
is there a special placement such as this for the other projections?
Finally your close… its the SMA, I dont use EMA. the top left corner of the chart I placed shows you which SMA points I use and their color coordinates.
I meant SMA! ok is there a rule for your B and C points, i haven’t caught any recognizable distinctions
maybe B is at a 1hr close above/ below 20SMA??? haha im just guessing :S maybe you just pick the candle closest to the fib although that seems too simple…
Same rules that you should have read in Larry Pesavento’s book and in this thread… I’ve spoken about the BC leg many times here ;).
But the general rule of thumb is to simply use your first and/or second swing after the A point as your BC.
Is there any chance that we’ll get to see your 4hr chart on chf/jpy?
Trading any patterns TMB? Im not seeing much forming. I entered eur/usd at 1.2259 88.6/127, that is the only apparent pattern I see.
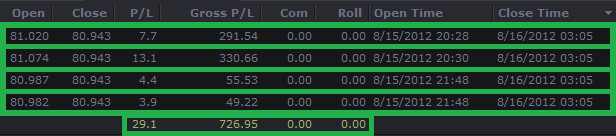
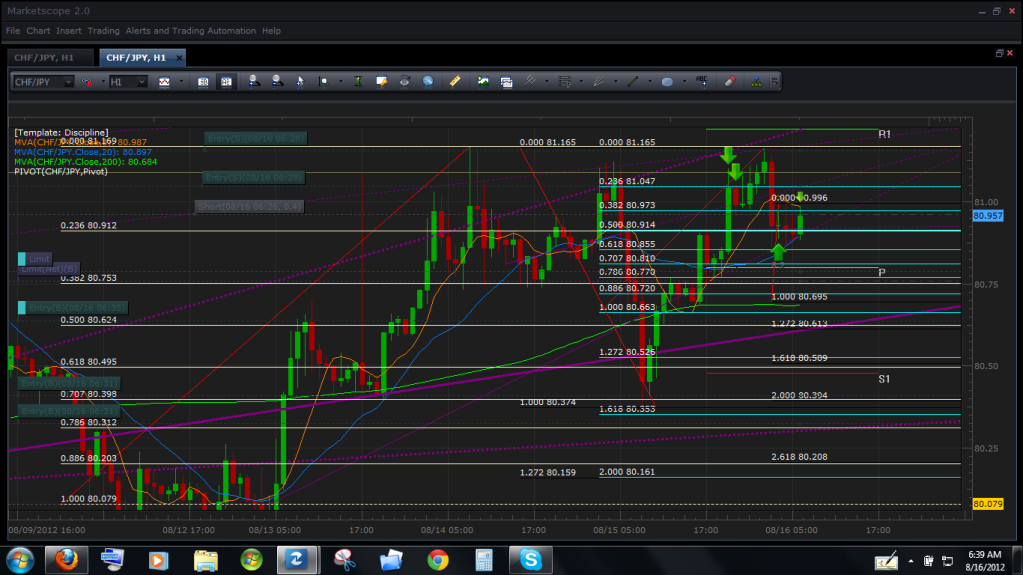
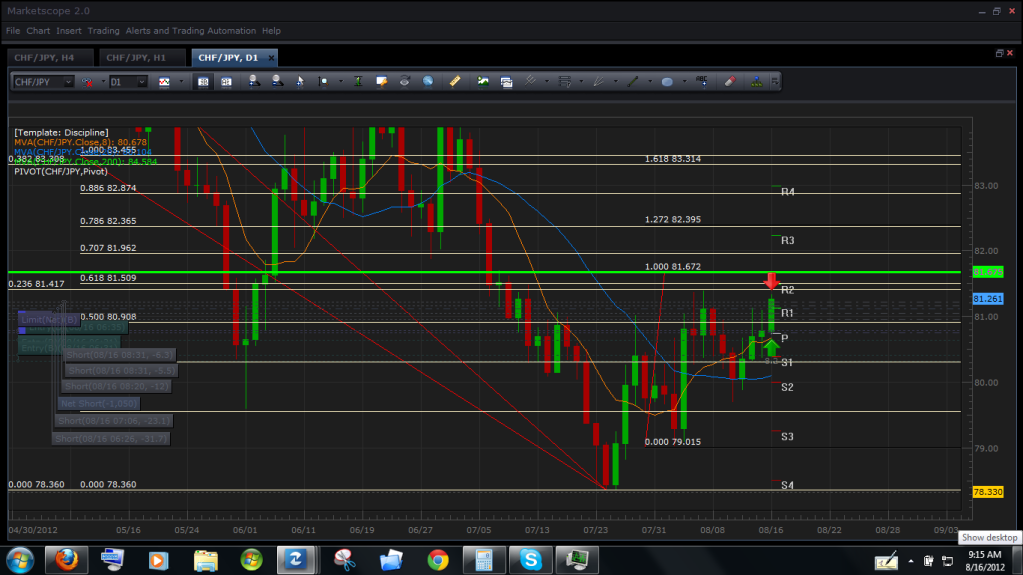
Well I scalped a bit of the top last night on the CHF/JPY and exited after support was hit… I was also very sleepy so I went to sleep right after the close and just happened to wake up right now. From what I see though price is currently in what I like to call “no man’s land” since a break both up or down can cause an equal pip movement and entering in either direction at the moment maybe too risky until a decision is formed. On the other hand, since price is so tightly “squeezed” the break on the hourly should be sufficient to trade C to D. Instinctively though, I see price moving towards the south on this pair. This is because of the fact that the previous high was already tested and an ascending triangle was broken towards the downside in the process. As a result, I will slowly build a hydra towards the true D point for the buy which I see as 80.394. However, I see support enough to move price up for 15-30 pips before reaching the true buy zone and will be exiting the short at 80.756. As a result, I will attempt a buy at 80.624 and scalp the market… Bellow is my chart:
The Hydra has been built for the short and bellow you will see the patterns and resistance trend lines triggering the trade:
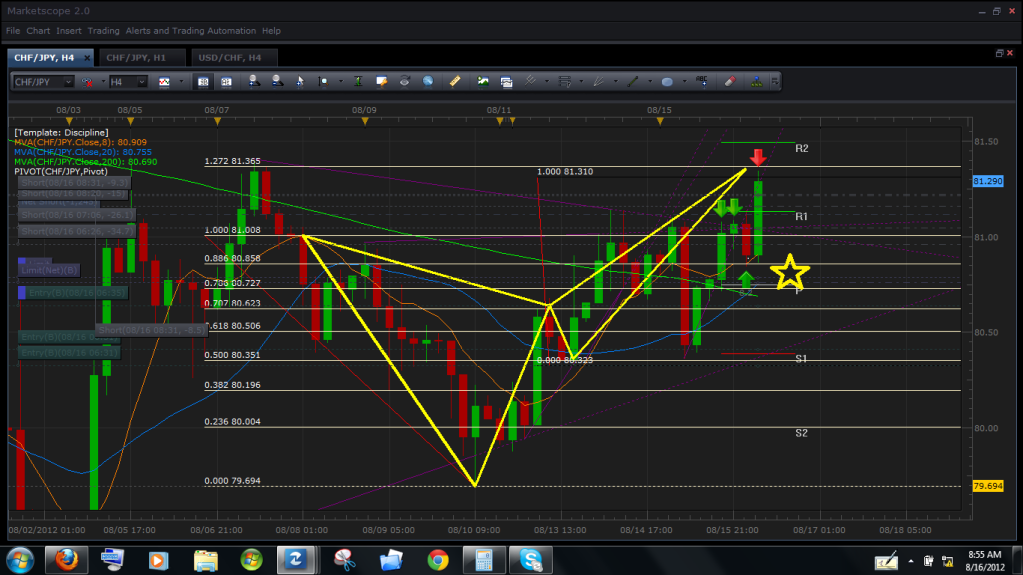
Above you will note that the 1.272 of XA and 100% CD have been triggered in the 4 hour chart of the CHF/JPY. I will take this short towards the star shown in the image which is the .382 of AD. Our exit is an hourly close above 1.272 of XA
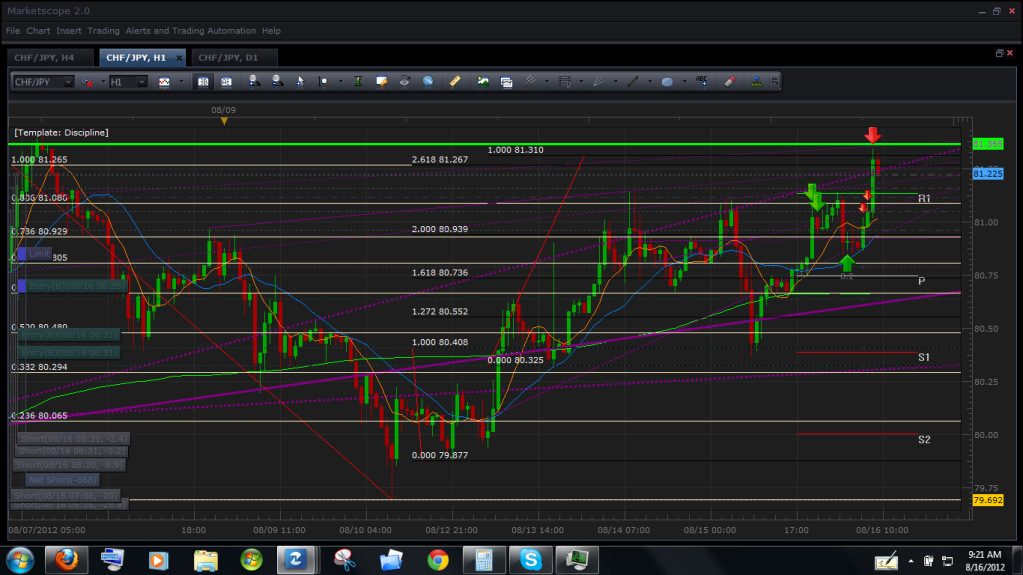
The green horizontal line in this image represents the 1.272 XA of the 4 hour and an hourly break of this zone will constitute failure. Even though a 4 hour close would be the appropriate exit further analysis shows that price has a good possibility of reaching 81.672 if a break of the current resistance where to happen (the image bellow illustrates the possible pattern that the daily chart will reach. On the other hand, the multitude of developing patterns within the current zone and the fact that previous price action has fallen from this area, indicates that we should attempt to sell… which is why I created a hydra for this trade. Happy trading

Looks like I should have placed my chart on the ask after the final entry was triggered. As a result the bid halted and closed bellow the 1.272 XA of the 4 hour on the hourly chart, while the ask broke the final resistance and pushed towards the predicted zone. Since we are still in the short and now in between two major conversion points, my trading team has advised me to keep the trade until we see a defined closed on the daily. In effect, we will be releasing 20-50% of our positions if price begins to “flirt” with the conversion zone before a daily close.
two requests to TMONEYBAGS
-
do some trading and analysis on XAUUSD
-
your chart is not clear, very difficult to read the lines.

any thoughts on this butterfly? confluence with a pivot resistance, 1.272 of XA, 1.13 expansion, 2.00 BC projection… i haven’t considered patterns on other time frames but let any input on the structure, and if I drew it right or wrong, would be appreciated…
Thank you!
its a 1hr chart by the way… sorry about the crappy quality, I use the “save as image” option of Marketscope and this is how they come out  any idea how to improve the resolution?
Munyont,
Can you try to get a screenshot. If you dont have a keyboard button you should be able to download some program to do it. Id be happy to give you some insight but I just cant see it.
TMB,
So what is the rationale for placing the X at the relative high of the 8 SMA? I have many times noticed yen pairs that just close past my typical convergence zone (using your old methods) by a couple of pips. They then do a reversal.
For pairs like audusd eurusd, my convergence zones have been respected very well when correct “d” point. Do you use that on 8 SMA X on yen pairs, or on all pairs?
Well I was curious as to why the markets where not respecting the majority of fib levels when drawing XA and I began to note that in the past I was able to find lots of butterflies and as of late I could only find Gartleys that would respect some of the fibs… mainly the .707, .786, and .886. In addition, I’ve been learning how to trade with the MVA’s this past year and a half but never used harmonics directly with it… I would simply trade the breaks and use it as confirmation for price continuation and additional support/resistance (when use correctly it works great trading C to D). Recently after much frustration in trying to integrate both trading systems, I remembered that my mentor had initially taught me to search for the x by using the base price to wick. Come to think of it… trading wick to wick works best in volatile markets and using the base price in ranging markets… it makes logical sense both in theory and in practice heh. Anyways, the curve of the 8 mva acts as the average price of the swing, the majority of the times if you use the curve as your X the higher time frame will be the close or average of base price closes. I’ve tested this with every time frame and have been trading with it ever since. One thing I would like you all to note that I do not want you all to go through is that after learning a new system and techniques of trading, one tends to forget the important of the previous system or steps. To clarify, it is important to take in all the factors when trading, knowing and using the basics such as trend lines, triangles, h & s, are just as important as knowing and paying attention to candle stick patterns. The combination of these things and a thorough analysis of a pair in all the time frames using them is key to success in trading. Gartley and Butterfly patterns are simply the “icing” in the cake and what gives your trades an edge. A cake is not a cake with icing alone  it takes multiple tools and ingredients to make a good one.
Excuse the late response, I was :24:
-
This week im solely focusing on the CHF/JPy and NZD/JPY, I will have time to review other markets on Sunday; you and every one else can submit a request if you want for this … I will pick three markets at random if others post. As for XAUUSD I dont have that listed with my broker.
-
right click any of my charts here and click on show image and it will make it full screen, clicking it again will expand it a bit more.
nice one tmoneybags. I’ve been using Heiken Ashi / H & S, double tops, triple tops comibined with paterns for enterance.
Chart patterns should definately not be used on their own IMO. Even scott carney uses RSI.
@munyont here’s mine> Question: What made you chose point C the way you did? I would define it as follows:

https://www.dropbox.com/s/4mou896vy8uurjc/aug17.1.jpg
I look for the B point based on which swing had the largest pullback and C is simply the next swing high/low
chfjpy 1hr
i traded this as a 1.272 butterfly and got 30 pips out of it but now it is turning back to retest the potential reversal zone and I don’t have the experience to know if it will hold or if there is going to be a move up to the 1.618 of XA to form what Scott Carney calls a Deep Crab…
i believe one of these two things will happen:
-
1.272 of XA could show another rejection between 81.70- 81.85
-
1.618 of XA and the confluence it has with 1.272 expansion and the 2.618 BC projection (as well as pivot resistance) could be where price moves up to and is subsequently pushed back down… PRZ would be somewhere between 82.248- 82.35
if someone can come up with an alternate scenario please let me know, I realize that these are pretty wide PRZ’s but at least a range of where the reversal might occur can be seen
this screenshot is probably going to be blurry so i uploaded it to screencast maybe it’ll be clearer there (click on full size)
chfjpyonehr1 - munyont’s library
thanks guys!!
