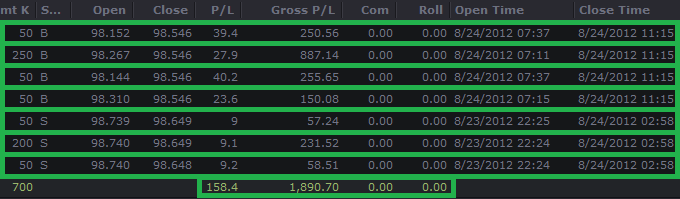
I closed out my position at 35 pips and decided to watch for a retest. A few factors made me think that higher prices might come, and the resistance just doesn’t seem strong enough. I am still watching it.
Edit: This made me think of the first time I really hit a big trade in Forex. TMB had made a call on the daily chart for GU and had forcasted a 400+ pip move. This was over a year ago. Sure enough, although it took a lot of time, that sucker moved almost to a tee on the call that was made.
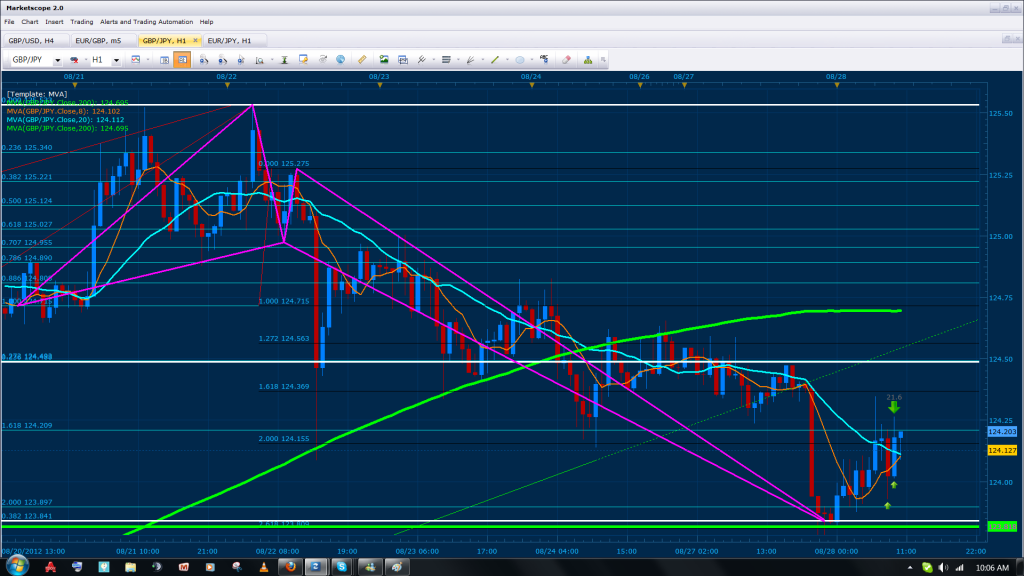
Theirs too much resistance between the current bottom that it did right now on the hourly and the highest point it reached. Their are trend lines that price had not tested before coming from the 4 hour that where just hit just before the 11 am close. I will be waiting for a 4 close and note how it reacts from the current position before exiting. If I am faked out, a daily confirmation institutes the reversal… In other words, tomorrows bar will be the continuation or reversal of the current movement, the zone of 1.26-1.2576 will be the deciding factor on which direction we go. My target is still 1.24895 and it is a very conservative target given the strength of this pattern. BTW, sniper… im no longer interested in predicting 300+ pip moves I rather scalp my way towards that direction and make 1-2k pips while it moves towards the predicted zone.
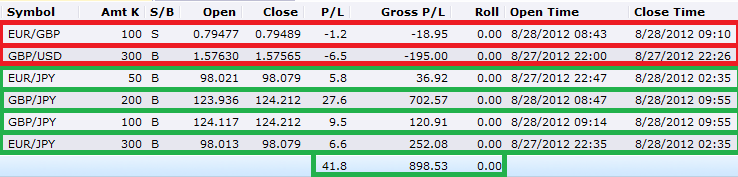
Im liking this EU short. Last London I shorted at 1.2567 and when there was convergence broken on 4 hr pattern around 1.2543, exited at 25 pips expecting price to test the next 4 hr extension and re-test the daily pattern at 1.25739-1.2595 (78.6/127). I re-entered at 1.25739.
Im debating what to do about this trade. I dont like that the daily convergence zone is 20 pips wide and that it never quite tested the 1.2595. However there seems to be plenty of good reasons to be short. The Daily bar did a nice job of closing under the 1.25739.
Price is also at a top of a trend line. The top trend line seems to reject price quickly, hopefully it will do the same this time.
Price respected the 61/100 nicely, indicating either CD & or XA is being respected.
The jump from 100%CD to 127%CD was not done in one big bar.
TMB, how do you factor in everything that is going on in the market? Or Do you solely rely on technicals.
The only thing I see going against this trade is that people just continuing buying the EU after the QE3 surprise. My opinion is skeptical, and given the latest good numbers since that meeting I wouldnt put much stock in it, but that doesnt take away from the fact that more people are inclined to long EU now.
There really has not been any good data from EU, the pmi’s were not impressive. And the merkel speech didnt bring great news.
Also the Euro has been well on the rise since the beginning of the week, before QE3 mentions. Given that were coming up on the last trading sessions, is profit taking the more likely outcome?
Look at todays movement and think like a major market mover… I’m going to always try to buy low and sell high and when I’m selling high I want to reach a zone where most people think price will continue from that point because their focused on the big bars. As a technical trader I need to be aware of how market movers may communicate with each other; this can be a volatile movement in the one minute indicating future direction, previous price history on the higher time frames where bankers used the zone as reference for major moves all in combination with harmonics and basic patterns which allow us to pinpoint human emotions and peeks in price. Take note of the support and resistance zones I posted yesterday:
Theirs too much resistance between the current bottom that it did right now on the hourly and the highest point it reached. Their are trend lines that price had not tested before coming from the 4 hour that where just hit just before the 11 am close. I will be waiting for a 4 close and note how it reacts from the current position before exiting. If I am faked out, a daily confirmation institutes the reversal… In other words, tomorrows bar will be the continuation or reversal of the current movement, the zone of 1.26-1.2576 will be the deciding factor on which direction we go. My target is still 1.24895 and it is a very conservative target given the strength of this pattern. BTW, sniper… im no longer interested in predicting 300+ pip moves I rather scalp my way towards that direction and make 1-2k pips while it moves towards the predicted zone
The support resistance points all came from the daily using base price and MVA’s as reference… as for the fundamentals… Yes I have my father advising me on his view points since he has been trading commodities physically since the 90’s and knows how to maneuver himself well with these details. Unfortunately as a technical trader I’ve found that trading with the fundamentals cloud my judgement and make me bias towards market direction, much the same way when trading daily, weekly, monthly patterns and not simply using them as reference for the movement or scalping them during the initial hits. As a result, I look at the news as an indicator for market volatility rather than direction. To clarify I make sure that when major news events are about to come out I have already completed my trades before hand and wait for the news reaction and/or depending on the market and conditions my entries are placed on MAJOR support/resistance areas. The daily and weekly support/resistance zones are perfect “breathing” points that the market makers use for news since they trade on a daily-monthly chart bias. Think about it, if you had billions of dollars to trade, you could afford to have a 100-300 pip stop loss with proper money management… especially when you’ve spent months analyzing the markets with a team and your projections are for 3-12 month periods (using the lower time frames with bots or with another trading floor to hedge positions through scalps). The trading game is a lot broader then what I have mentioned and one should note this every day they enter a trade…
Good day TMB and everyone else. TMB I’ve been reading this thread for 3 months now and I completely understand how to find the patterns that you explain in the beginning of the thread. What i don’t understand is what a symmetrical market looks like and what an unsymmetrical market looks like based off of zig zag lines, what u explain in the beginning of this thread. Do you mind posting a pic of each one for me to get a better understanding?
A market that has equal amounts of buyers and sellers is symmetrical, a market that does not have a complete bias in direction is symmetrical, a market that is not ranging is symmetrical. If patterns or heavy resistance/support areas that form reverse past the .236 to at least the .382 of the leg measurement, it is symmetrical, if it does not have this than you are are in a ranging market with a bull or bear bias.
I am kicking myself in the butt for not holding on to at least a portion of the GU trade earlier. Even closing off 3/4 of the trade would have netted me a 5% increase in the account (I closed at around 7% increase.) I have had a very nice move in my equity curve over the months because I am quick to let go of losers. The same fear that drives me to get out of the losers also drives me to close my winning positions too soon and losing out on the big winners. Too many times I have seen this over the last year in my trading. Aligning solid discipline with my trading plan has served me well, but I need to step it up a little on these big drives like this.
Can you post the pic of why you took the longs. I see the Major Daily Pattern that you took a short on. But Why did you go long when there was a daily pattern pushing price lower?
So these resistance / support places you are looking at come from the open and close of the daily bar. You also use the moving averages in the same manner.
Market Makers will push price to these zones because thats where they place their positions?
Also, you stated that when prices are ranging it is better to use the Base of a Candle for you X, and when price is trending it is better to use the wick? Is there any rule of thumb of differentiating between the two? Is the SMA method more appropriate for your hydra trades?
Don’t commit my mistake… I began to see things the same way when closing 30 - 60 pip moves became a breeze and it’s taken me a long time to come back to the realization that consistency is what causes one to win in the long run, not catching a 100+ pip move (that can take 1-3 days to work at times) and gloating about it… or self exalting your self because of it.
Always keep in mind that 30+30 = 60. In other words, lets say I take 10 trades a week and 7 of them give me 30 pips while the others fail and I lose an avg of 15 pips on each… 30 x 7 = 220 and 220-(15 x 3) = 175 pips a week.
The above formula equates to the following:
[B][U]Balance[/U][/B]
10 - 19.9k = $3500 ($10 per pip x 2 [lots]) or $4480 ($12.8 per pip x 2 [lots])
20 - 29.9k = $5250 ("" “” x 3 [lots]) or $6720 ("" “” x 3 [lots])
30 - 39.9k = $7000 ("" “” x 4 [lots]) or $8960 ("" “” x 4 [lots])
40 - 49.9k = $8750 ("" “” x 5 [lots]) or $11200 ("" “” x 5 [lots])
50 - 59.9k = $10500 ("" “” x 6 [lots]) or $13440 ("" “” x 6 [lots])
60 - 69.9k = $12250 ("" “” x 7 [lots]) or $15680 ("" “” x 7 [lots])
70 - 79.9k = $14000 ("" “” x 8 [lots]) or $17920 ("" “” x 8 [lots])
80 - 89.9k = $15750 ("" “” x 9 [lots]) or $20160 ("" “” x 9 [lots])
90 - 99.9k = $17500 ("" “” x 10 [lots]) or $22400 ("" “” x 10 [lots])
Now lets simulate the above on a 10k account and lets trade with discipline analyzing each trade we take and doing an avg of 10 trades a week applying the above table and formula… With consistency the account would grow like this:
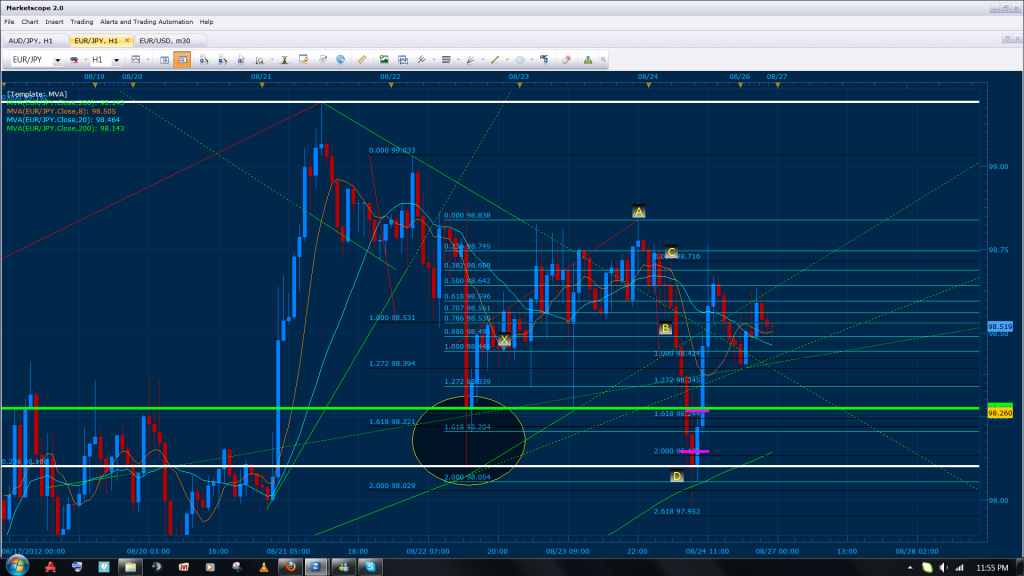
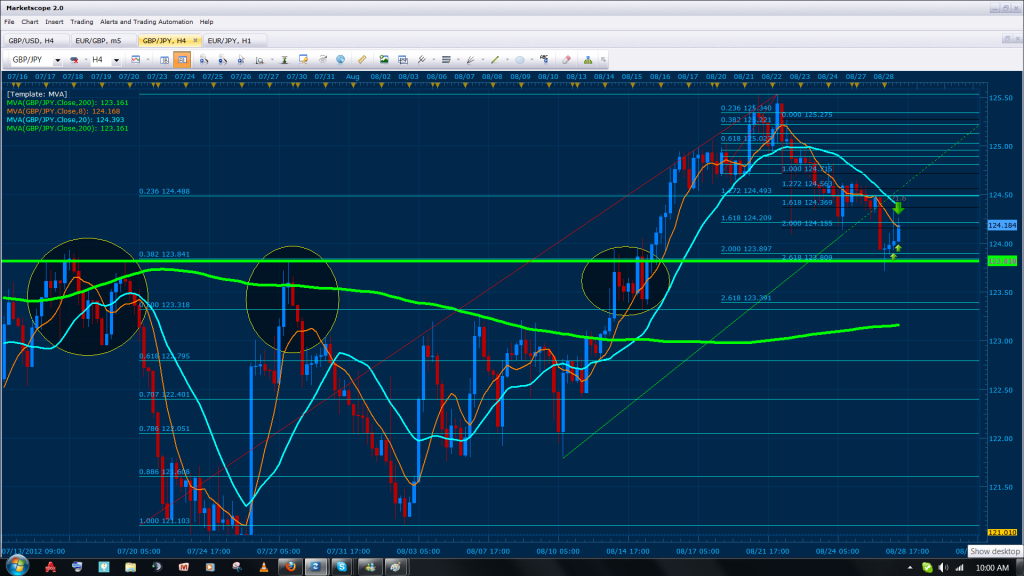
Their was a Gartley on the 4 hour where 200% CD converged with the .236 of XA. In addition the BC of the 4 hour bullish pattern was a butterfly on the hourly and thirty min time frames where 200% CD converged with the 2.0 of XA. The circle in the chart above illustrates that previous price history had found support within this same convergence range and the green horizontal line is the bottom of the 8MVA curve from july 31st. The magenta horizontal lines indicate my entry points and my exit was just before the retest of the triangle price had broken down from with out testing.
Hi TMB
Ive been following this thread for months now and i want to thank you all for all you’ll knowledge and wisdom…i completely understand the system but for a week and a half now ive been getting bad results…failed failed failed…I need some insight on what im doing wrong! Take a look below
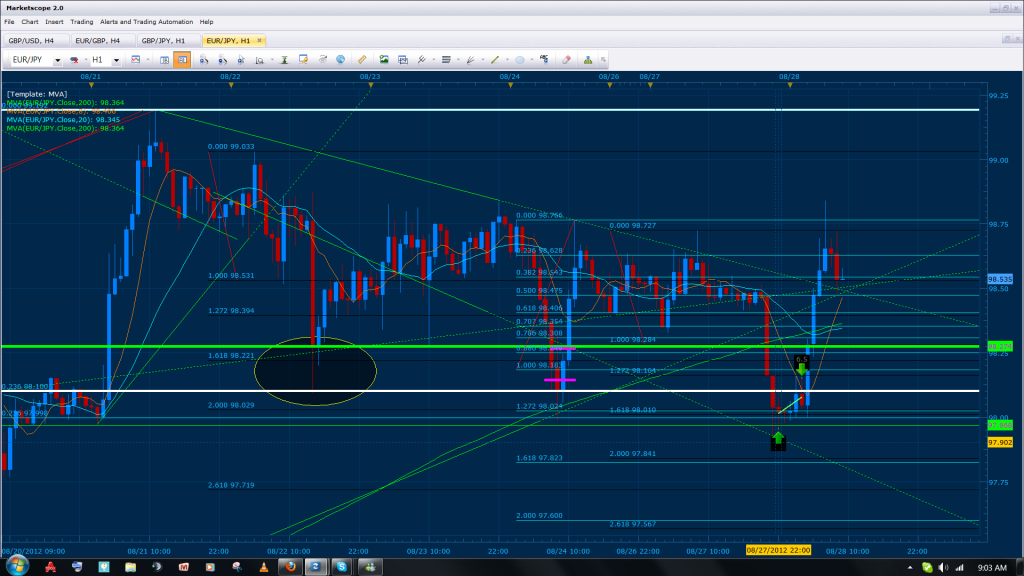
Well… knowing what pair your looking at exactly would help. But if this is the EJ… which it looks like it is or has a similar pattern to it, you have forgotten one very important step; you must do your top down analysis of the pair. I do not see any trend lines coming from the higher charts nor any fib points at all and I know that around 97.998 their is a .236 from the 4hour and daily XA which converges with the 1.0 and 161% pattern you have drawn. When using the MVA as your X, this convergence point portrays a butterfly where the 1.272 of XA converges with the 161% CD.
I took the trade for the buy last night, but was too sleepy to monitor it. Nevertheless you should note that my entry was at the 161% CD because with a thorough analysis I have pinpointed the appropriate d-point.
I’m sorry TMB … I didn’t give you the proper info you needed for the correct response…sorry u had to guess that one thru. I was just do frustrated from losing consistently that I just threw up anything for a response. I will make sure next time you know what I’m trading and what time frame as well. I will be posting patterns more frequently for you insight. I need to get better at this
 I rather scalp my way towards that direction and make 1-2k pips while it moves towards the predicted zone.
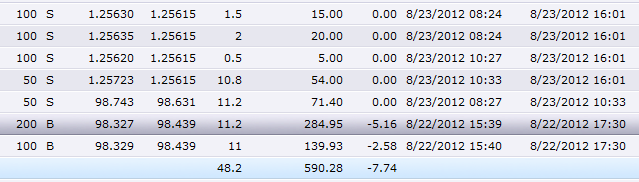
 ill take profit between 20-30 pips no matter what. Fell into the illusion today of wanting more lol