Both the Ausi and the Nzd markets have had no volume this month… the avg pip movement ranges from 5-10 pips on the hourly and 15-20 on the 4 hour… its a recipe for disaster if your not a major player. Best to choose another market that actually has some type of volatility.
Thank You Sir, I’ll take that on board.
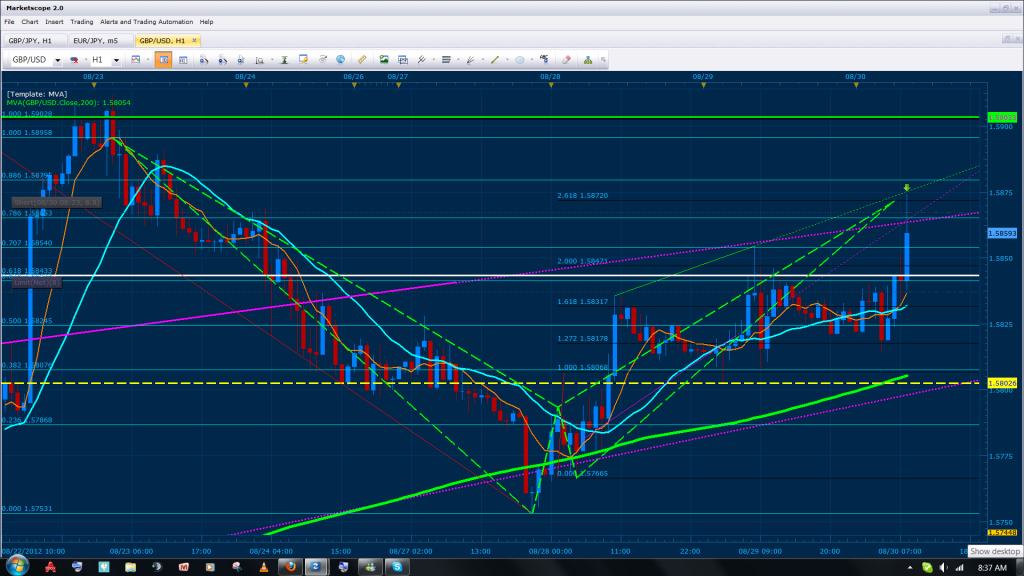
Just entered a short on the GBP/USD where 261% CD converges with the .786 and .886, I will be posting the analysis shortly.
For the GBP/USD on the hourly we have a Gartley pattern forming a D on the extremes of the .786 and .886 of XA, where they both converge with the 261% extreme CD when using the first swing. On this chart the yellow horizontal lines are conservative targets for the daily pattern that was triggered previously and caused the initial bear movement of the pair; the green horizontal line at the very top represent the daily 100% CD that was triggered. The purple trend lines are major support resistance areas that create an upward channel from the hourly and the 4 hour. As you can see, the convergence is crossing with these major lines and they are what “pinpoint” the current D’s location. A break of this on the 30/60min chart will be the failure of the trade. Even though I can take this to the first conservative daily target, I will only be taking 30 pips from the trade and waiting for a pull back or break of the MVA’s to continue towards them.
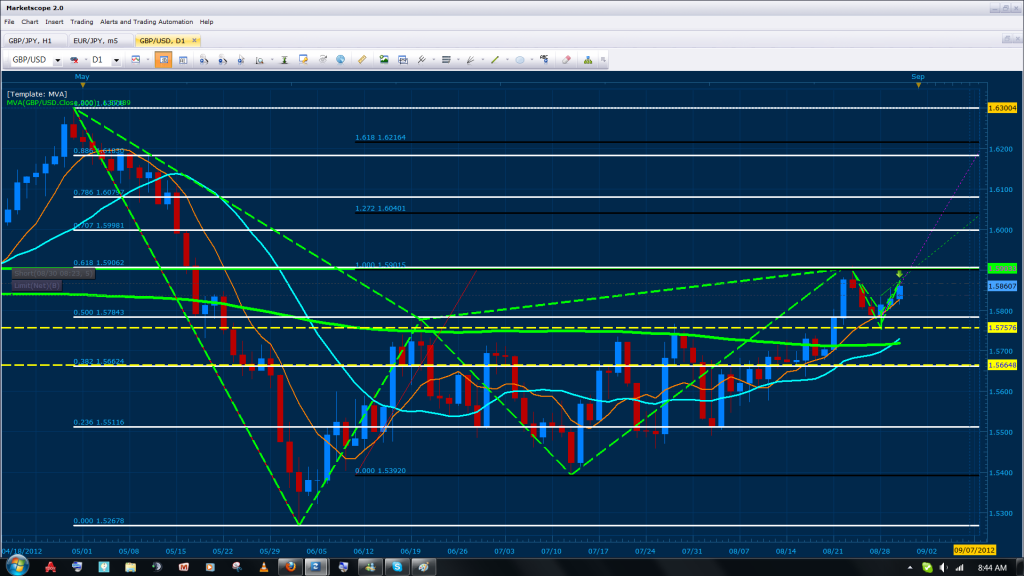
The above image illustrates the Daily pattern that was triggered on 08/23, price has respected the convergence and currently is creating a flag before further continuation. I’m using the most extreme points here for my XA because they where respected to the “T”. In addition, the Daily targets are illustrated as yellow horizontal lines representing the .236 and the .382 of AD. Please note that price has already reached the .236 previously and I’m expecting it to reach the .382 shortly. In other words, until the daily D point is breached, I will be looking for shorts towards these zones.

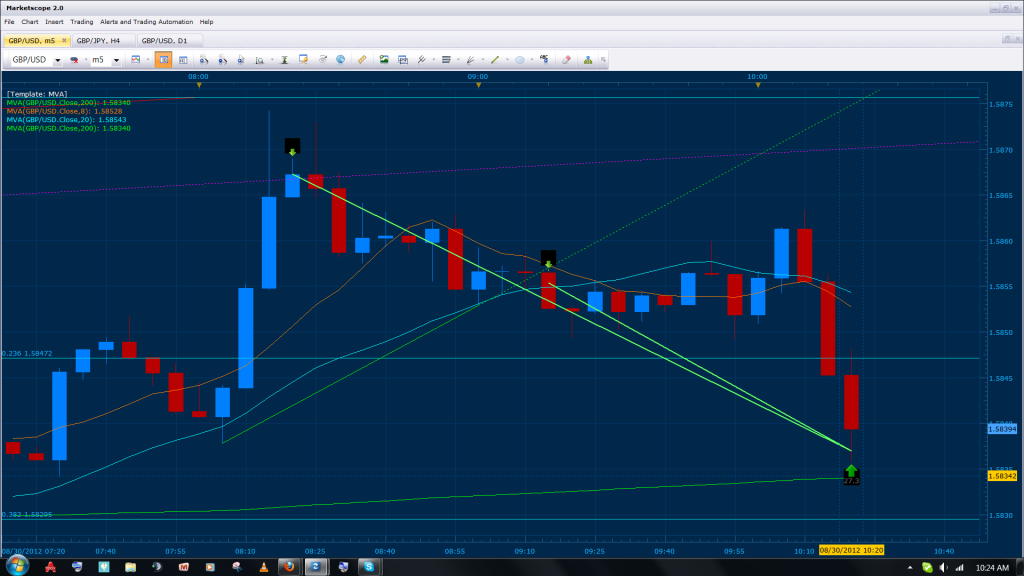
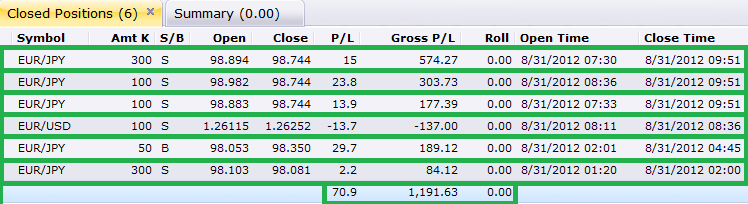
Bellow are today’s trade and results, please note that after the break of the flag on the 5 min, I entered an additional standard lots but kept the target the same.
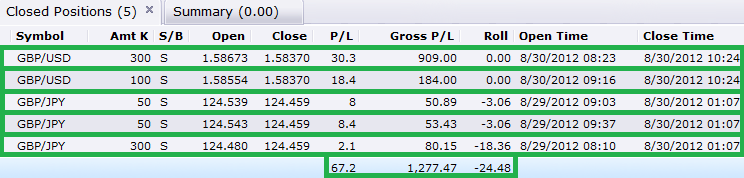
The GBP/JPY is a trade I had entered in early by mistake and was forced to keep it open until the break of the true D point or pull back towards break even (as you can see i closed after the pull back towards break even).
[QUOTE=TMoneyBags;391061]For the GBP/USD on the hourly we have a Gartley pattern forming a D on the extremes of the .786 and .886 of XA, where they both converge with the 261% extreme CD when using the first swing.
Great Call, its still falling (currently 1.5779), thats nearly a 100 pips.
TMB. How do ur pics come out so clear and large enough to be read??? Whats ur process???
yes, beautiful trade, congrats!
I press prtsc (print screen) on my keyboard, paste the image on paint upload it to photobucket.com then i just insert the image as a url here and uncheck the box that says retrieve remote file and reference locally. All my images are stored in my photobucket account.
If you guys take a look at the NZD/USD there have been a couple of patterns forming.
Last night I saw this pattern (yellow lines) and the entry triggered around midnight. When I woke up I had a nice profit.

Right now I’m seeing another pattern forming in the NZD/USD (red lines). The PRZ is at trend line (yellow doted line).

And lastly I also see a Butterfly forming in the USD/JPY.

Okay gonna try it. I have some trades that need critiquing … Thx TMB
I thought this title was going to say “30 pips a day keeps the boss away” 
TMB,
Although I know you have had some support from family, I am amazed at the level of success you have created for yourself over the years. This forum alone serves as a book, although only a small overall glimpse, of your development and commitment to becoming a good trader. I have watched as you evolved your methodology to become the success it is today. Over the years I have returned this forum post many times to reinvigorate my own trading and refocus my direction. Personally I just want to thank your for the time and effort that you have put into this thread and say that I hope you will continue to share your knowledge and experiences.
I figured I would post a recent trade to show that I actually have taken away a bit from this forum. I am still a “beginner trader” but have smoothed out a lot of the edges that come with being a new trader.

Click Photo To Make Larger
First, an admission about this trade. This is not how my charts generally look and I apologize for how crude it looks. I was tipped off to this trade about an hour before the trade hit D from a friend I also introduced to this strategy. As a general rule of thumb I do not trade Fridays. Also I almost never have this chart open on my client. My personal view on this trade is 2 fold. It was both a winner, and a loser.
Trade Explanations:
I still use the “extreme points” as my X which is all I have ever learned or tested. Following the yellow price retraces up to the 50% of XA. After a clear BC leg is formed I draw my fibs and notice that the only convergence that I have is the 123.6 of AB to the 88.6% of XA. It isn’t that great of a convergence so I draw an extension of AB and it falls almost exactly on my 123.6% fib. NICE!
As a rule I would use the first clearly defined AB leg as a anchor for the rest of my trade. It’s keeps thing simple and a completed pattern generally has a higher probability chance (are you thinking in probabilities yet?) or succeeding. I wish I had labeled it in my chart… meh I will just add another picture below. Okay so now I have a new red line. This leg is not extremely important to the pattern BUT I like to use legs like this for additional confirmation of the entry. So taking the extension of the leg I notice that the 123.6 extension lies near my fib cluster entry point. OKAY!

Click To Make Larger
An additional note on this RED leg. This is a strong leg. It pushes hard and strong. I was expecting a to be able to drag the fib of this leg, drag it to the low, and see the 100% of the leg on my entry fib levels as well. To my surprise it was a bit higher and nearing the previous extreme high. I have no objective proof but my experiences alone lead me to feel that price was likely to come to this point more so than just the fib clusters. Yes I said “feel.” I don’t like to be subjective in trading, but it worked for me this time.
I decided to place two entries, one at the fib cluster (i marked this cluster as green price sign) and the second at the 100% of the Red leg (Orange Price Sign)
CONFIRMATION: In all honestly I trade the patterns as they are. I am being made more and more aware that trying to find other means of confirmation is extremely important to longer term success. I have blew a whole account trading oscillator patters. HOWEVER, one thing that has worked for me over the years is using divergence in MACD and Stoch. The purple lines in the picture show this divergence. This was a signal to me of downward pressure in an upward moving market.
The Trade: Entry 1 was hit. Entry 2 was hit a short time later. Then BOOOOM! Market plunges. (Okay I will NOT feel euphoria just because I was right!) I exit at the RED price sign. It was 25 pips of my first entry and 35 pips of my second entry. Why did I exit so early?
Why I said I this was a “loser” as well as a “winner”:
I did NOT know that each pop would equal almost 2x what I am used to trading for. Therefore my positions were much larger than I would generally take! Noob Mistake.
I feel I should have scaled off the first entry and left at least part of the 2nd entry on. I was near the 38.2 of AD when I exited but with such a strong downward move I should have left at least a little on the table and shot for the 61.8. This is a weakness of mine and one that looking back at my trades would have netted me many more pips than I would lose over the course of time.
Hope this was clear and informative. Cheers and Happy Trading.
I’ve been struggling with having the discipline to of just close my trades after acquiring my target, my emotions just toke over and started running the trade. blew up my account too. In hindsight I made all the mistakes; getting over confident, risking too much of my account and hanging on to a losing trade too long. Looking back i’m kinda happy i went through that cause that experience humbled me as hell, not saying that i probably will not make the same mistakes again but i’ve got the taste of what happens and that taste isnt one i wanna taste anytime soon =). downloaded the “Rules of the trade by TMB” thats attached to this tread made a few modifications to fit me and have those rules next to my screen, when ever in doubt or get emotional i just look at it and work according to them. Nothing wrong with trading to your target even though you see the market go higher, your target is met. That’s what its all about for me, consistence =).
Thanks to TMB and everyone contributing to this thread here.
Happy trading =)
Happy new week of trading everyone, lots of harmonics and lots of monies to us =)
Does anybody know if there is a way to keep the text in the charts in the MT4 Platform so they can be seen in all time frames? I enter the text but whenever I change the time frame the text disappears!
Thanks in advance
Tell me how dear