Hi, I’m new to harmonic pattern trading and I thought I would give it a shot also I would like to thank TMoneybags for sharing his knowledge on this.


EJ Sell Now… Posting Analysis in a few minutes 98.737- 98.877 is the sell range
98.037 was my entry on a buy. I just closed it out at 63 pips. Best trade I have had this week by far. Was watching for this sell to form as well.
Edit: Add Chart:

Click To Make Larger

Also on my 4 hour chart there was a Trendline converging on my D point as well.
Good morning all, their is a bearish Gartley which has developed and triggered on the EUR/JPY where the 100% CD converges with the .707 and .786 of XA. In this scenario I am using the most extreme points for my XA leg because current price action is volatile and it tends to respect these points. In addition, their is a possibility with this volatility that price reaches the 127% CD before completing the goal. As a result, I have divided my lot sizes accordingly and placed an entry within the sell range of 98.737-98.887 which are the 127% and 100% CD points. In addition, between those converging points there is a heavy resistance zone which price can test and is adding to the strength of the current pattern (this is seen as the purple trend lines). In conclusion, the target for both entries is 30 pips as always and our stop will be a break of the purple trend lines on the hourly.
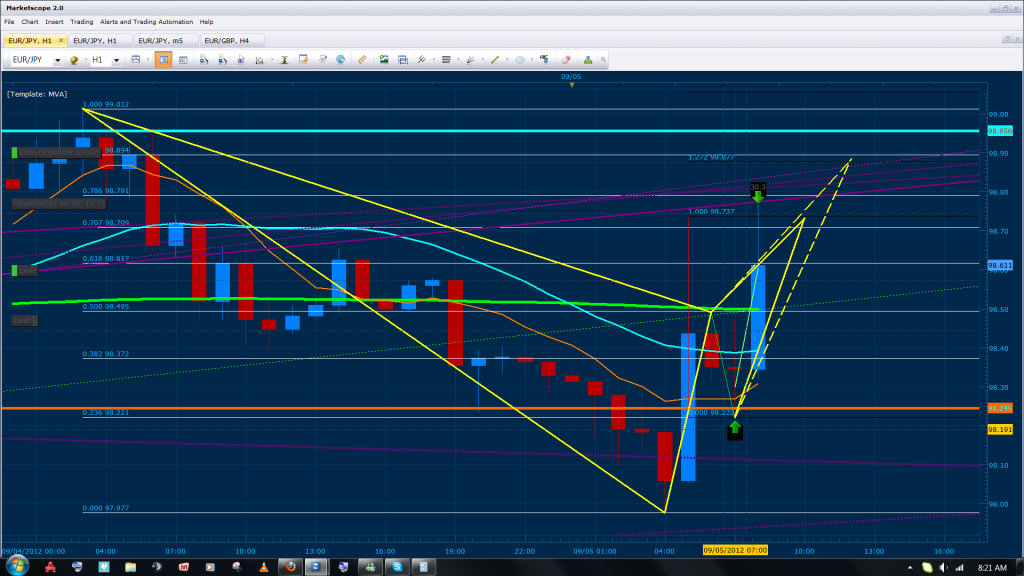
PS. I traded C to D using the halt of the MVA’s and break of prior resistance as my entry  for 30 pips.
Since price respected the 127% CD convergence but broke the major resistance trend lines, I will be moving my limit above 50% of the previous hourly bar 98.647. Current price action on the lower time frame and the analysis on the 4 hour shows that it can reach at least 38% of the 4 hour bar (98.568). We expect price to reach 98.475 before deciding on a solid direction… as a result, the new limit is conservative and will simply be a bonus to today’s earnings. Keep in mind that a 30 min close above the 127% CD or a bullish candle stick pattern developing on or 5 pips near the convergence point will be an excellent stop signal.
98.66 was my tp1 on this trade and 98.58 my tp2 based on simple fibs. I have already moved my stops to Break Even. Just icing on the cake at this point, but your icing is much more expensive than mine
Bellow are today’s Earnings and Yesterdays losses + today’s earnings.
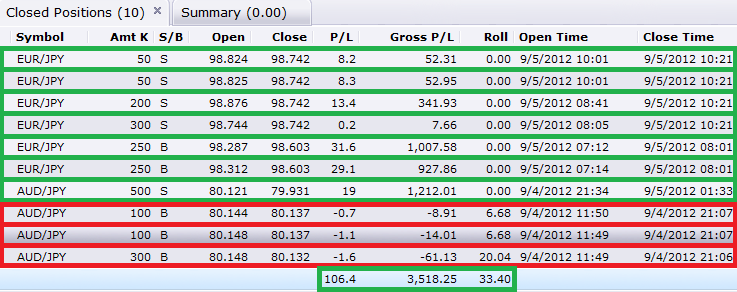
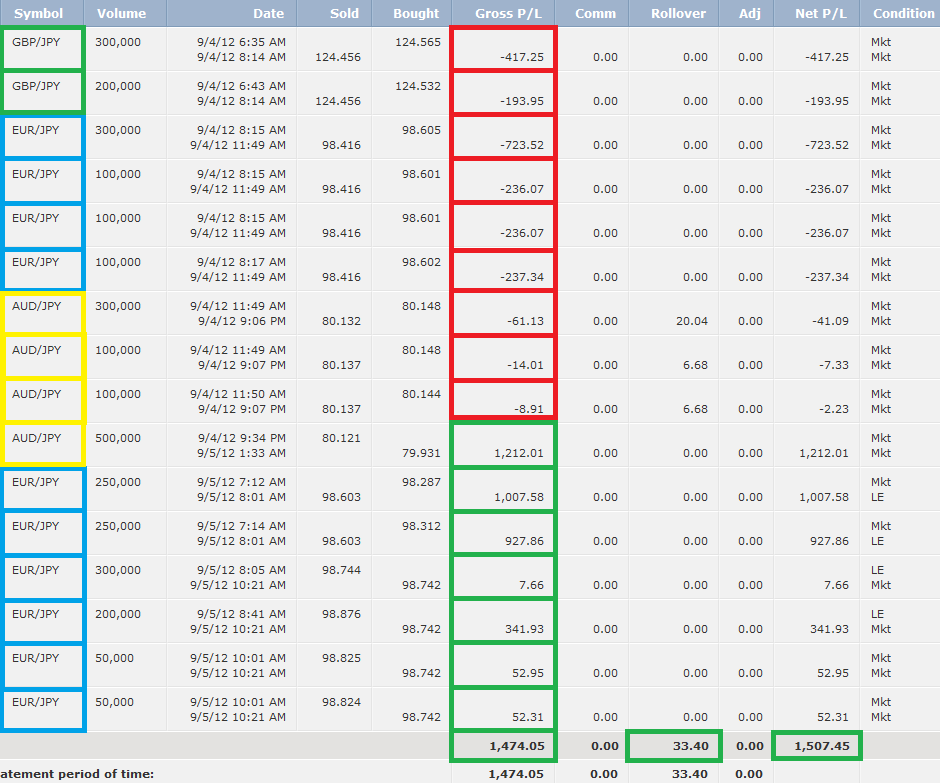
I exited out near break even on the recent “bonus trades” because I need to go take my wife to work… heh  shes the one setting up my website and creating my twitter/facebook account or w/e lol before the Seminars this fall… so I have to leave. Anyways, take note of the above images and always remember to NEVER GIVE UP, Consistency is key in trading. As you can see I was “chopped up” at the start of September trading but persistence allowed me to end up with gains. BTW, I will post my analysis and entries this coming London session so y’all can have some freebie entries. Feel free to ask questions, I will be here during the evening analyzing and answering posts that come in.
Looks like the EUR/GBP has entered a sell range. It’s very likely with the news and technical standing that we see the euro/usd and gbp/usd move in opposite directions… be careful 
TMB, Im seeing the GBP re-test the convergence on the Daily at 1.5905, do you recommend entering that pattern given that price has already tested that area and is pushing closer?
This was a very slow and boring London session for me. I just sat on my hands as I didn’t feel I had any solid entries. Makes me think of something I read in a trading book. We have this expectation that when we go to work we will leave with some sort of reward or something to show for our work that day. Trading however, challenges this mindset and one must tailor there psychology around the fact that not everyday will you have something to show for your work. Alas, I would rather have sat on the sideline than jumped in and lost some.
Cheers. Maybe NY open will be better.
TMB,
If you don’t mind me asking, what are your annual performance figures in percentage terms since inception of this thread?
Thanks
found this pattern forming on the nzd/usd 1hr chart

did i draw the pattern right or should i have used a more extreme x?
Since trading for me is “seasonal” (I have strictly avoided trading from November 15 - January 15) My performance has been been based on quarterly gains where 33% is my min Monthly ROI, 100 % ROI is the monthly AVG and 420% the max.
EJ Target 1 = 98.274 || Target 2 98.1 || Conservative target = 98.624
Exit = hourly close above 99.02
Convergence = 98.901-99.014 Daily 127% CD with .786 XA (Retest of flag)
[B]Daily Break of this convergence will push price towards 100.0-100.25 on a bias up trend.
Daily Respect of this convergence will push price towards 97.968-97.876.[/B]
you gonna trade during news session soon?
I am trading during the session
lol that was fun watching the volatility come in and the spread go to > 10 pips. Now to see the close.
Edit: Sigh. Silly Me. Lost a week or more of profit in less than an hour.
4 hour pattern triggered, will be posting analysis shortly
Looks Like were heading towards 100.0-100.25 Area
So if price hits the 100-100.25 area do you plan on shorting the pair?