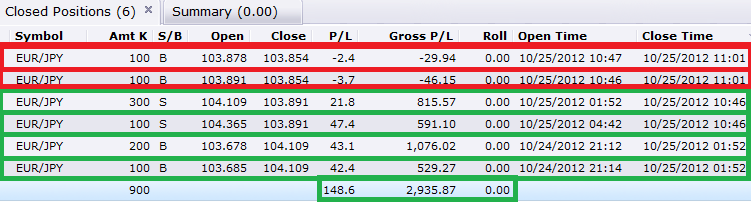
Bellow are today’s result, note that I entered the 100% CD bullish pattern that formed but let it go because i did not like its initial reaction to the fib and the close ( it faked out regardless ) i see price reaching the .886 lvl retesting the previous low. I will analyze the pair before the 9pm est close of the 4 hour and give my input on the pair.
It looks like my Bat on the EUR/USD panned out. I got in to it a little late because it turned at 4am my time. I netted 35 pips on it yesterday but I didn’t put it in and leave it. I was concerned I was wrong and kept selling it and buying after it dropped a little. It retraced from the .886 to the .50 and promptly dropped again. Could have been around a 70 pip gain from start to finish.
My EUR/CHF Shark didn’t pan out. It bounced off the .618.
Tmoneybags, is their anyways you could draw the trade so a newbie would understand. The picture you posted is kind of complicated. Also how many set ups do you usually find per week?
You can easily find 2-3 setups a day depending on the time frame your looking at. I tend to focus on one per market session when using the hourly chart; Yes I’ll conduct a thorough analysis on yesterdays chart and post it this afternoon.
Hey! i’m back, I got out of this thread for 9 months, I see that something has changed, which is Hydra? in my time that did not yet exist. Please some good soul could send me a post / link where you have a summary of it? About retracement, any change? Thanks.

had sat an alert at 0.886 but didn’t see it somehow, so didn’t trade it.

had about 20 pips, got stopped out at breakeven, would have reentered at the retest of 0.886,but don’t because i don’t want to be in the market over the weekend.

entered after the CD leg broke the low of B, just exited got around 40 pips.
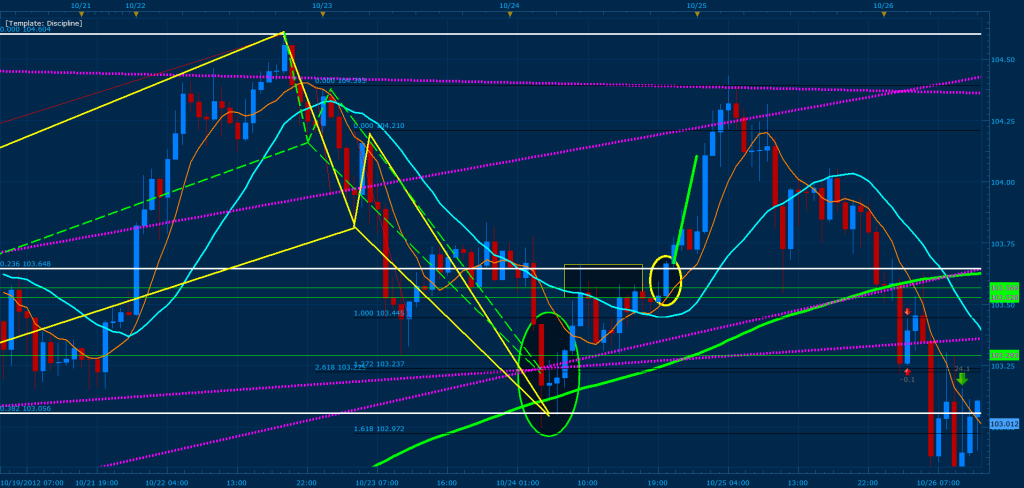
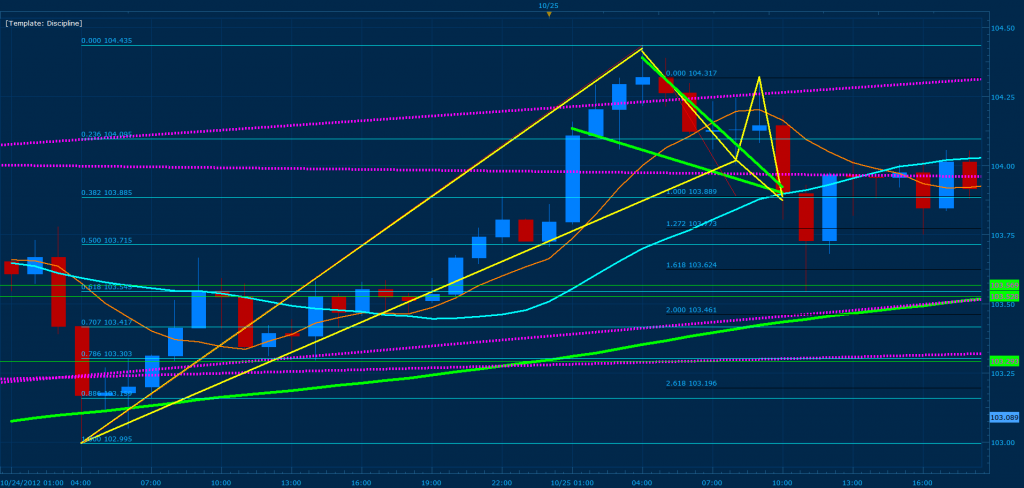
Here we have two bullish patterns which developed in the EJ the 24th, the green ellipse house the candle stick confirmation of the patterns and its corresponding convergence zones. At the wick of price within the ellipse price hit the .382 of XA converging with the 161% CD of the second swing (illustrated by the yellow gartley). In addition, after respecting this D point, price firmly closes above the 261% CD of the previous pattern that was broken (green gartley) and begins to flag (forming a triangle). The purple lines are swing lows and highs taken from the 8 hour using mva crossings and are responsible for major breaks and reversals which can be clearly seen in price previous to the triggered D point. As a result , the proximity of these lines at the bottom crossing with the convergence zones add to the convergence and to the strength of the pattern allowing me to swing trade towards the next purple trend line. The green horizontal lines are major support resistance sideways channels. As you can see we have a rectangle at one of these channels illustrating the strength of the zone with wicks and halts and forms the triangle. Once price broke both the flag (yellow ellipse) and the .236 of XA I entered into the buy and traded C to D ( C is the bottom of the only swing within the triangle. The green line above the yellow ellipse is my entry and take profit for the buy.
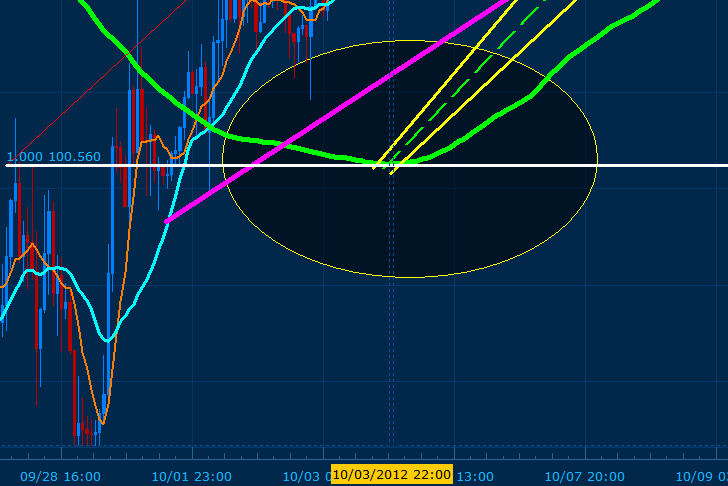
My X is coming from price 100.560 which is the bottom curve of the 200 MVA (Green) of the hourly chart highlighted by the yellow ellipse (X is 10/03/2012 22:00 est).
Bellow I illustrate the two D points triggered for my take profit when trading c to d (yellow line) and the hydra created afterwards with the short (green line). Here 127% CD converges with the .707 of XA (using highest peak aqua fibs) and the .786 of XA when using the top of the 8 mva curve (orange fibs). In addition, there was convergence with the 161% of CD with the 1.0 of the orange fibs and the .886 of the aqua fibs, using a break of the highest convergence point as my exit. Again, the purple lines added to the strength of this short.
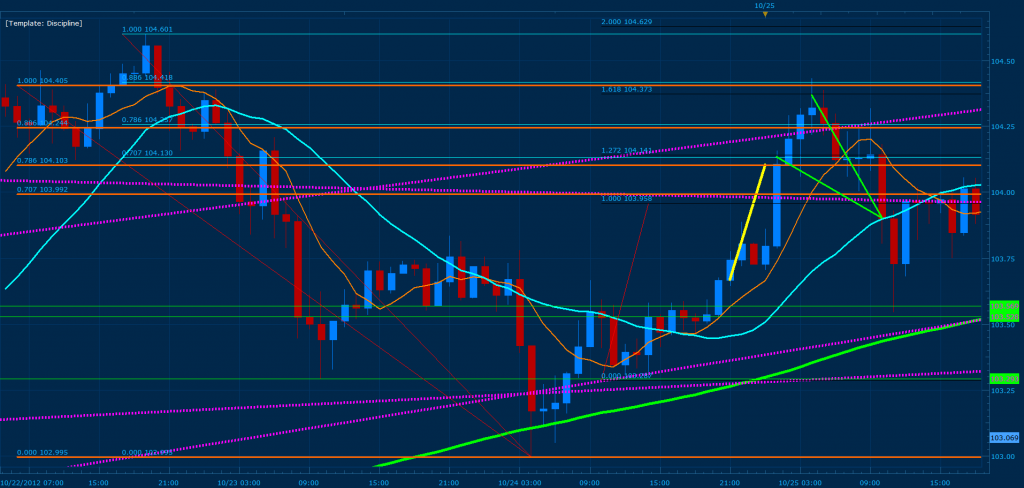
During the short, price created a gartley where the .382 of XA converged with 100% cd for a buy. As a result I closed the short here and reversed positions ( green lines illustrate the short). Once I saw that price closed close to the convergence zone for the long and at the same time broke the 20 MVA (aqua MVA) I decided to close out the buy immediately and end my trading day.
I hope this analysis will clarify my previous post for all who where confused; these trades resulted in a net profit of 2,935.87 and exact entry times and exits can be seen on my previous analysis. Have a great weekend!
Sorry for the late reply and no I have not read Trade what you see but I think I will read it now and I think I am going to start flittering my pattern searches a lot more with this sort of analysis.
TMB,
I was reading scott carney’s books. He does not seem to draw his CD projections by putting AB fibs starting at C point. He uses the extensions of the BC swing, 161/200 etc to find potential reversal zones. Do you have any experience with this variation of harmonics or any insight on this difference?
In my mind the whole point of Pasting the AB swing on the C point is because we are expecting the CD swing to be similar to the AB swing, because that is what other traders are gauging their entries and exits of of. His method just seems to be finding were there is a lot of confluence of fib lines.
Thanks
Can you help me out a little with the MVA crossing because I tried drawing them with the 20 and 8 MVA and was getting something completely different then what you had posted so to keep it short I did not know how to draw them and if I am using the right MVA lines.
Along with this - how do you decide which time frames to use? You’re using a 200, 20, and 8hr MVA. What makes those times better than others?
Think I found another Bat - USD/CHF 1 hour. The only point that is AB is roughly .48 (should be between .382 and .5), BC is .886 of AB, CD is smack in the middle of 1.618 and 2.618 as well as .886 of X.
Any thoughts?

i was in it yesterday and grapped 19 pips.
What do you guys think of this pattern on the AUD/USD. There are two patterns forming on it with convergence for both patterns at the same point. D should be at 1.0340.

which pattern is that?
I would say that is a Gartley. It doesn’t really matter now that price has traded higher than the A.
That AUD/USD was a symmetrical triangle breakout. There was an early/false breakout early on the 31st, but then it had the real breakout around 7am EST yesterday. I got in late and scored 13. Although, my entry go triggered on the initial false breakout first =( Glad I’m still practicing!
What do you all think of this pattern on the eur/jpy 1hr?
I am not liking the way it is dropping so I am not certain about this one

I was tracing your analysis and my XA 618 did not overlap 127 CD. I am assuming that your 618 XA is your support as you stated in your analysis? Can you explain the two static support lines (S1,S2, pp)? And lastly, the zone from the previous hydra is an indicator to enter the trade. HOwever, where did your hydra lie? How did you form the previous hydra? I am quite confused.
The biggest challenge, to me, in trading is to develop the discipline. But as time goes by we grow.