hey guys, heres 2 set ups I am looking at


Thanks TMoneyBags for sharing your knowledge! I will be following this thread and hope to learn more from you. Good luck and GAOTU bless you!

EU on a 4 hour chart.
Everything went catastrophic last week for me. 2 of my patterns did not “initially” go as planned. I backed out and “price action-ed” the chart instead. 8 hours later, pattern formed and proceeded in the correct bearish path. I am back to square one. Thank goodness I am still on a demo.


jeppe what indicators are you using on your charts?
Got some of the major EMA and SMA, other than that RSI(14).
the pattern and trendlines is hand drawn.
Hi jeppe,
In the first trade, you took a long AUD/USD on the first green arrow ? C being above A, what is your interpretation here ?
Hi.
it is a shark pattern.
a variation called 5-0 pattern is where you buy or sell
at the 50% retracement of BC

Very nice thank you :22:

What do you guys think of this? It looks like it fits the Bat requirements. This is the EUR/USD on a 3 hour chart
B is a 50% retracement of XA, BC is 50% retracement of AB, D is a 1.618 retracement of BC. I entered the trade on my practice account because a lot of things seem to point in an up direction, but I wanted to get your input on if you think this qualifies as a bat (Harmonic Bat Pattern)

I believe CD leg should extend to 88,6 of XA. I have looked at my charts, at the moment the price haven’t reached 78,6.
I was going through the thread a while back but for the life of me i can’t find again so I will write this question to anybody that knows the answer. What do you look for to trade in a symmetrical market? My second question is just in general but do you guys just go by every individual pattern and analyze it that way or do you analyze the pair to where price is and trade the patterns that form in that pair you analyzed if that makes sense. The reason for the second question is because I want to cut down the amount of currency pairs I am looking at and become more of an expert on a few then to know somewhat on a lot of pairs only if it makes me more money in the long run.
Eddie, when I look for a SYMMETRICAL pattern I try to look at how many bars it takes to form. I mean AB=CD should have roughly the same amount of bars. If you see less bars from C to D you might see a more aggressive move and a potential broken pattern. Have you read any of the Harmonic trading books like “Trade what you see”. He shows a lot of examples and what to look for when these patterns are forming
Thanks for that - if that’s the case, it hit a new low today which puts it almost at the 2.618 level (which is okay for the bat) and at the .886 level of X. I’ll take a new snapshot and post it up in a minute.
Here’s an updated pattern. Looks like I bought to soon - glad it was practice!!!
Can anyone else confirm for me?

One more I’d love to get your comments on. This looks like it’s fitting the Shark pattern (Harmonic Patterns - Shark Pattern). Any thoughts? It’s EUR/CHF on a 1 hour

Hello all, excuse the absence 
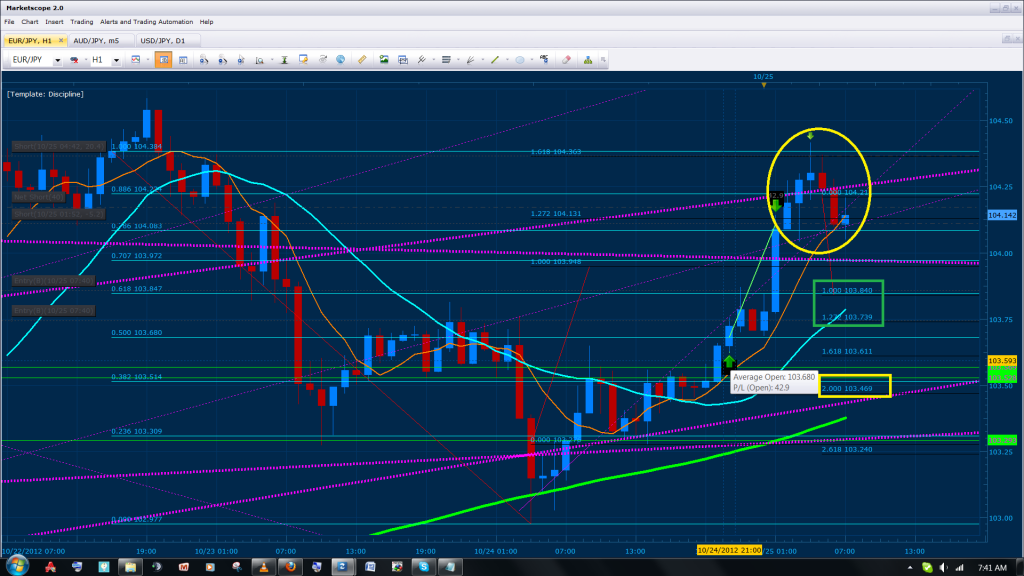
Bellow we have the EJ where I traded C to D last night and booked 42 pips, I entered the D points as a hydra and those trades are currently active. The entry points are the 1.0 of XA with 161 % CD and the .786 with 127% CD. If you where to use the most extreme as your X point, the 1.0 will be the .886 instead adding to the convergence. Please note that I have a green box and a yellow rectangle highlighted for you which indicates where we will reverse positions and take profit. The green box represents the initial take profit and the 100% cd and 127% cd. Here the 100% CD converges with the .382 of XA when using the most extreme point and when using the MVA curve, the 127% CD converges with the .618 of XA. Please note that the BC leg can be clearly seen on the 30 min-5 min charts and C lands around 104.235, in addition, it is a .382 retracement and this constitutes that CD has an 80% chance of reaching the 127% cd (the reason why I have a hydra lined up for this buy. You will also notice that we have a yellow box around the 200% CD, this is because if the expected buy fails, price has major resistance between the 200 and 261 % CD and it is a reminder to jump back into the markets in such a case. I understand that their is major news coming out around 8:30 and am aware of the risk. As a result, remember that each of these points are major support and resistance zones and the breaks or respect of either point can constitute major movements which we can take advantage of. Happy trading and be safe!!! BTW, im heading to NYC this weekend and will be active on the forums upon arrival.

Thank you for the input and extra confirmation  was looking at this closely as well because for a few minutes it looked like the EJ and the EU would separate from movement because of yen weakness