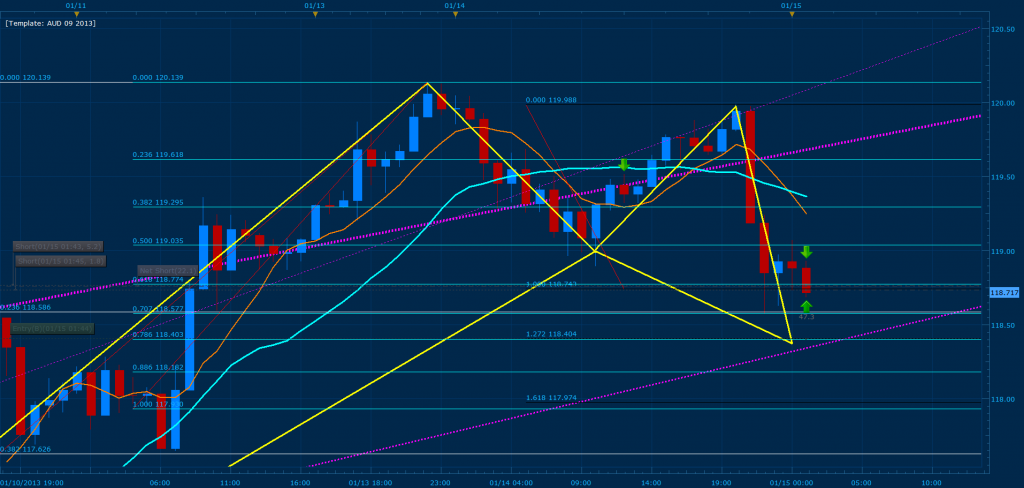
Well the trade worked, sort of. It crashed at 100% of CD rather than the 1.272% level where i set the trade and i missed out.
If I moved X to the 8 MVA, i’d have picked the correct convergence… doh!
Well the trade worked, sort of. It crashed at 100% of CD rather than the 1.272% level where i set the trade and i missed out.
If I moved X to the 8 MVA, i’d have picked the correct convergence… doh!
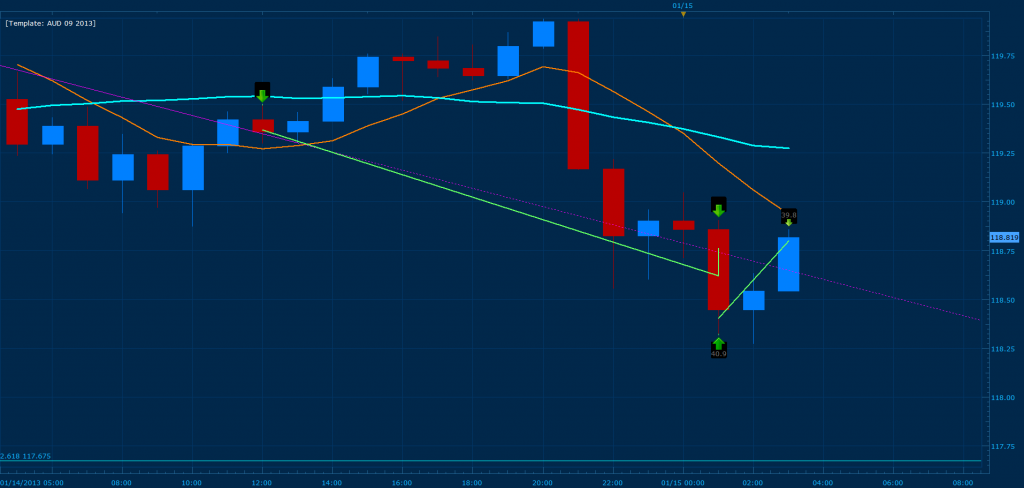
I hope you took that trade lol… I left mine running for the night and booked 50 pips just now (you can see the entry on the fourth photo from yesterdays QA) and the true entry as you have shown it 100% CD worked out perfectly.
Missed it  See above

No point crying over missed opportunities…
Think i’ve found another. WHen i move X to the MVA it gives the same convergence…
The flag for the bearish continuation has broken on the EUR/JPY after violating the 100% CD on the 5 minute chart. AS a result, I am selling C to D towards 118.404 where I have my bullish entry waiting for the gartley where the 127% CD converges with the .786 of the most recent XA. If this current convergence zone where to break, I see price free falling towards the 261% of CD at 116.729.
I see my error, using Wick to Wick, i didnt see the convergence at that line, only the one below, when i used MVA for X the convergence appears.
If i’m not mistaken that was another 30 pips to TMB. I am in awe of your knack for these patterns, well done! I got 25 pips, i got in a little late and moved SL to BE when it should have been a few points lower as per your assumed entry, thus i reentered. The two bullish pins were a great sign!
Thank you 
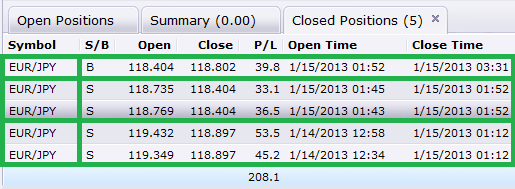
The three rows represent three trades I took from yesterdays market close until now (in pip value). From top to bottom the first row is profit from the bullish gartley, second row was trading C to D and the third row was the overnight trade.
Happy trading 
PS.: Please keep in mind that the marabuzo that developed on the four hour yesterday at 21:00 EST is a sign of Yen strength and should be monitored closely. To clarify, this development after a huge uptrend is the first signs that the market is looking to “correct” the bullish move and test the major levels its broken. As a result, expect price to either consolidate in the current area or continue to pull back 50-80% of the previous bearish bar to prepare for the bearish continuation. Again as I stated before, if price breaks 118.404 then we should expect it to reach 116.729. In other words if you are going to continue trading this pair today, be mindful that we are now in a 159 pip range (consider the marabuzo and the current hammer developing on the four hour as the length of the range) and you should keep your entries at the tops/bottoms of it for secure profits and exits.
Yeah, congratulations for another good trade!
I have to agree with djhenry. Your understanding of these patterns and price movement is really impressive! You’re really close to getting a forex-/gartley-guru if you’re not allready there of course! 
I seem to have some difficulties seeing the same as you though. I’m drawing them exactly as shown in your post but i get different results (hard to spot any convergence of fib levels) even if i try to draw from base of price, MA or wick to wick. I need to figure out why. Maybe it is because of the MT4 platform not able to switch between BID and ASK price.
I would like to show you some examples of what i mean by posting screenshots. Am at work atm though so i have to do it later.
open a demo account with fxcm so you can use market scope 2.0 and execute your orders on mt4.
Ok, thanks Tmoney. Looks like i need to buy a pc after all since i only have a mac at home running mt4 on a crossover program. Well well, a good investment into my future business i guess.
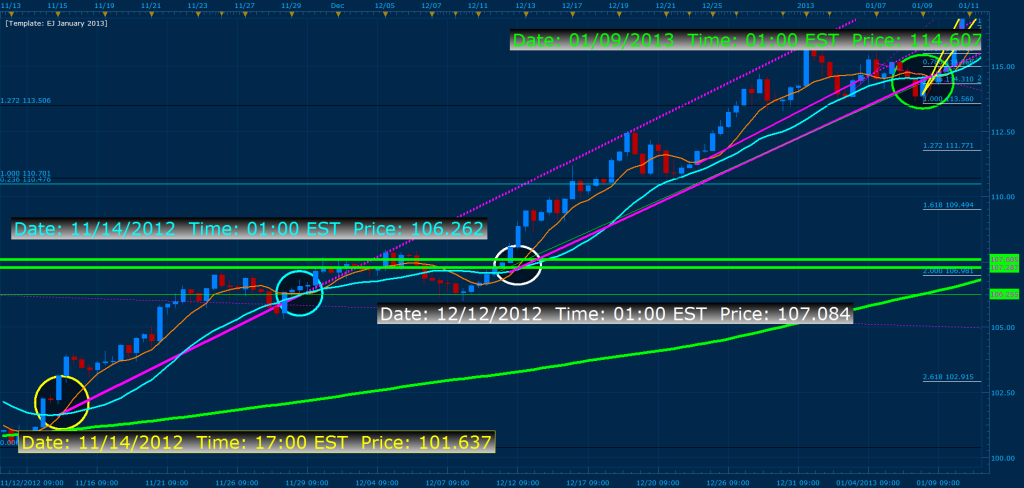
TMB, What is lower purple line on first picture in your post (EJ Bullish Gartley 01 15 2013 Complete)? Can you explain it? I see that upper line come from crossing 20 and 8 SMA but I don’t know what is lower line. Thanks.
trendline.
read the posts above.
jeppe, I know that it is tradeline, but I do not know how TMB created it. I try to make this on my chart and I can’t. I read posts above and I think that I know how TMB draw trendlines. Every line which show TMB I can draw but this one not. I mean lower purple tradeline on picture -sorry but I can’t attach picture yet.
Use the 8 hour chart to plot these lines. Please note that when you draw trendlines on the higher time frames in market scope and then switch to a lower one, the lines generally move and are not in the same position. To fix this, make sure that all the trendlines you draw in this style are set to “free hand” and not snap to nearest. In addition, you must zoom out your chart in the lower time frames until the previous history is shown and then you can zoom back in with the adjusted lines. To clarify, I zoom my chart out by scrolling my mouse wheel back all the way to the point that I can not scroll the chart any more and then move the mouse wheel up to zoom back into a “regular” view.
Thank you TMB. As always your explanation is very helpful. Now, everything is clear
Do you use every period on chart to draw your trendline (30 min, 1h 4h, 8h, 1d and so on.)?
The technique works in every time frame just like fibs and harmonic patterns do. As a result, the higher the time frame the stronger the resistance/support will be. In effect, its all really a matter of preference (your trading style). I personally like to keep the major support/resistance zones from the daily, 8 hour and 4 hour charts shown on all the lower time frames. Then I draw the support resistance zones for the current time frame on the chart.
You can always use “boot camp” on your mac if you have OSX or later and install windows on it as well. That way you can benefit from both worlds without having to do a heavy investment (majority of traders whom use mac trade on the windows side of it because of that same issue).
Thanks for the hint, one of my collegues at work does just that. The only bad thing about that is that it slows the mac down pretty much, at least thats what he is experiencing. But hey, you can always buy some extra memory and thats still cheaper than a new pc so i think i’ll do just what you suggested.
Anyway, looks like i finally managed to find a bearish gartley with perfect convergence even on MT4. It’s on the EURAUD, Daily and there are two convergences. So far it has respected the convergence on the .500 and .786 levels and price has moved down from there. I get a perfect convergence at the 1.000 and 1.272 levels.
Could result in a big reaction, even though we just take 30 pips right? 
Please let me know what you think about this one?
Edit: Let me correct myself here. This is a bearish butterfly since D is above X right?