My broker is markets.com since they have an office here in Stockholm where i live. It’s easy to just go by and pay them a visit if i have any questions or just want some good advice using their site/software. Nice and safe to be able to meet a representative from the broker from time to time.
Hi TMB, thanks for sharing your knowledge. I don’t want to go off topic but do you trade set ups other than gartley’s and butterflys? Just curious. thanks!
Found another Gartley scored 30 pips on it yday @ the 0.500 mark; let’s see if it bounces again this time @ .618. Two bullish pin bars at the D. Seems like good sign…
As always, comments, criticism or death threats appreciated.
This pattern looks like you drew it well, but you should be using the first or second swing on the butterfly you drew on the previous post (the second swing being the previous swing low to the left of your C).
Caught it at the fib line, was was watching the trade, so i probably should have waited, but with the JPY so volitile atm, i just used a buy limit order. Up 16 pips, Stop to BE.
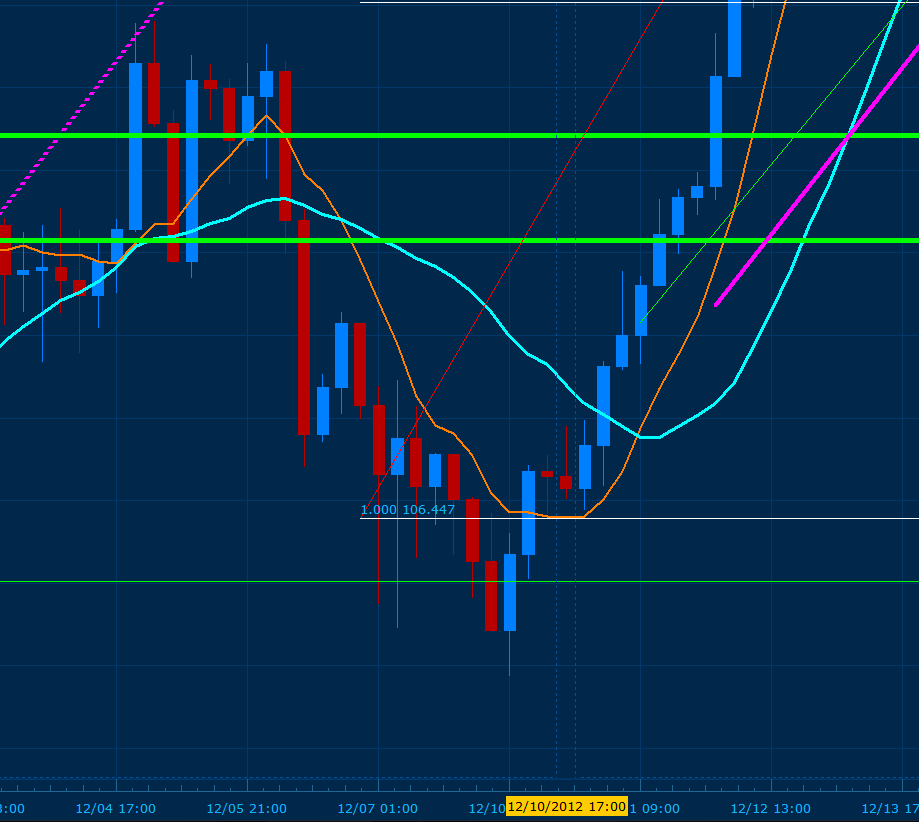
The bullish gartley I have been anticipating this week has finally been reached but missed my entry by 10 pips. Bellow you will note that the 261% CD converges with the .236 of the major XA (White fibs) and also shows a butterfly at the 1.618 of XA on the 1h/30m fibs. Currently a morning star has been formed confirming the buy, but neither the 261% CD, the 1.618 XA, nor the purple trend line has been hit directly. As a result, I will risk a short towards C to D and place my entry higher to the previous wicks price has touched. My exit on the short would be a break above the previous channel or 17.498. My entry has been moved from 116.729 to 116.908. All in all if this zone is respected as its showing, expect price to reach 119.00 (minimum move towards 118.50). A significant break of this convergence zone (Bearish) will push price towards 114.909.
Booked 23 pips from C to D and reversed the position manually at 17.030, my target is 118.00 which is 10 pips before the .382 of A to D and 100 pips before the projected target.
What is your major fib’s X point, that has the 23.6 om this convergence zone. My 50% XA is right at 116.85, I entered at the 261.8 at 116.90.
Why were you comfortable shorting after price already touched down into this area if you expected price to bounce here.
Why was your target 10 pips below the 38.2 and not the 38.2?
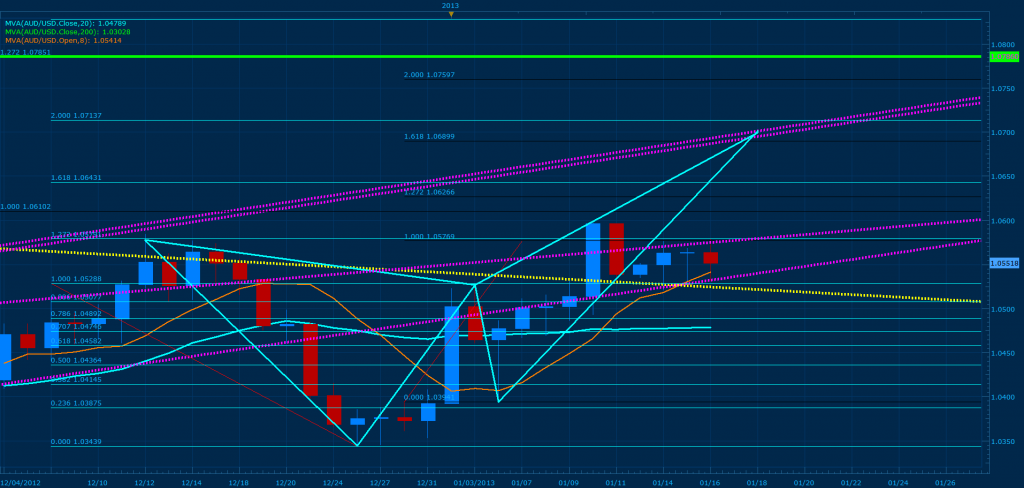
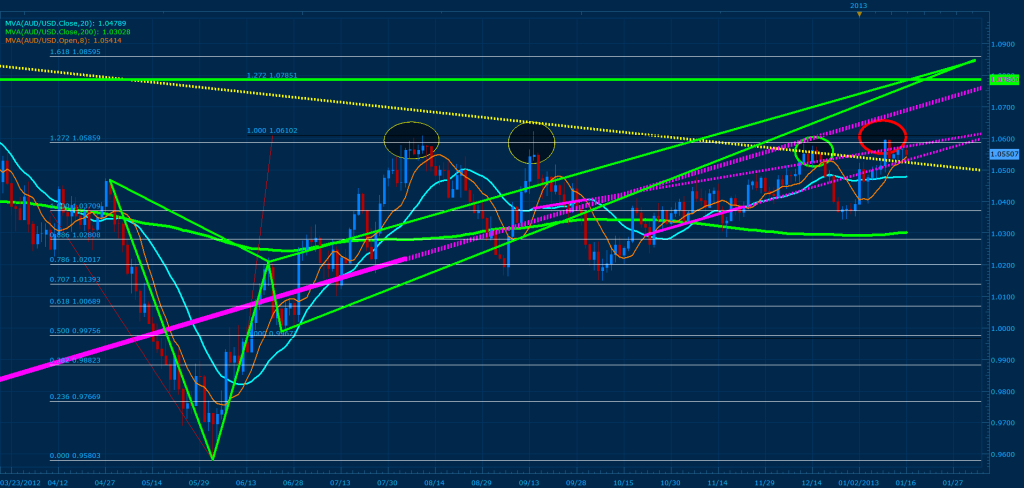
Also, what do you make of this AUDUSD Daily pattern. The convergence at 88.6/127 was superb. Price has already done a huge a bounce since Respecting convergence at 1.0570 area. Now Price closed one daily bar above but it gapped down to the convergence. As Diable posted there is a a couple smaller tf patterns converging around 1.0570-1.06. Would you advise these playing these smaller tf patterns, or is the risk of a breakout to the upside to likely?
Similar to what I did, but i used a bullish butterfly off the 8 MVA. I also tried different X points at for a 15 point convergence at this level but having said that, i got a few different convergences on the same point, so i set up an entry, see below.
I just took 50 pips on that EJ, Gartley / Butterfly. Once it hit roared through the 30 pips mark (given as TMB pointed out it should safely get to 100 pips), i set a 15 pip trailing stop and let it go.
Today i’ve traded 6 times, Total Pip Gain 44.4, of those was the USD/JPY trade that failed for a 17.7 pip loss, albeit i thought i moved my SL to BE, obviously i stuffed something up. The other loss was a EUR/AUD which again worked but i failed to move the stop to BE after 10 pips (although i thought i did) and lost 13.6 pips. Without those two mistakes in execution of trades, i’d have probably walked away with a 2 pip gain on each so in theory, today i should have walked away with 100% success (in that no lost pips in any trade) for a total of about 79 pips.
I know TMB system is quit when you’re 30 pips up, ideally with one trade, but i’m trading every good pattern I see atm to get use to spotting patterns and convergences. I’d rather screw up on a demo account than a live account.
I did however place a live E/J trade and gained 60 pips on my live account (which is predominately a trend following account) which got hammered with the fall in yen the last two days.
Thanks again to TMB for all his help, and for that matter, everyone who has contributed on the thread.
Out of experience, I do not recommend trading major counter trend patterns on the daily until price has confirmed that it respects the zone… (especially the Ausi pairs which are known to blow through these points and continue with the major trend). If you decide to do so however, make sure that you are only using 25%-50% of the maximum amount of lots so you can “survive” any fluctuations that may occur before price respects the zone. In addition, make sure you have the chart fully analyzed before considering trading such patterns… For example, I note that you have thoroughly analyzed the current daily chart but I do not see anything reflecting the higher time frames.
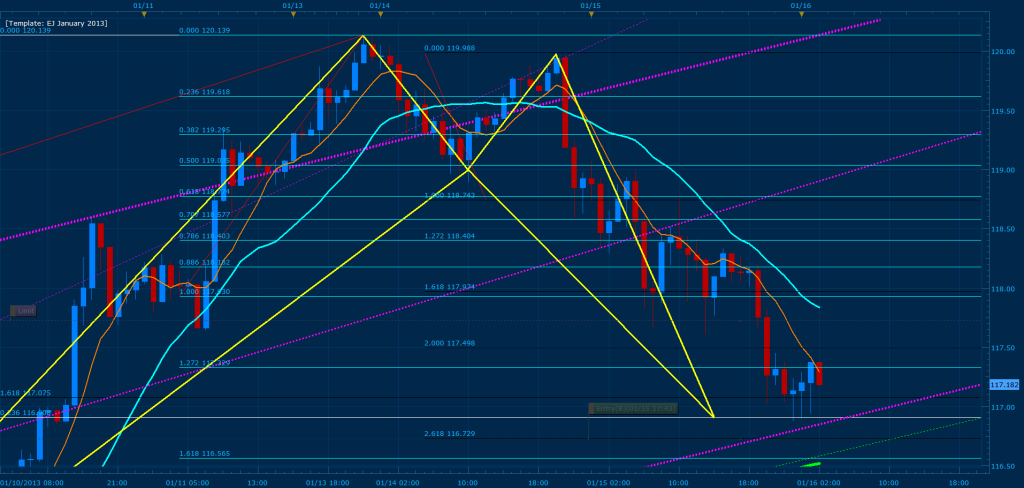
Above, I re-drew your most recent pattern using the top of the MVA curve as my X instead of the most extreme and the trend lines you see on this chart are coming from the weekly and monthly charts. The yellow trend line that has been broken with force and retested various times with bullish hammers forming on top of them is the top of a major triangle from the monthly that has been broken with a 1,580 pip apex. In other words you should be looking for bullish patterns developing for the up trend at this point towards the extremes of price until a significant bearish signal develops. The bottom and top purple trend lines are coming from the weekly chart and represent the bullish channel price has been following. As you will note here, we are currently in the bottom of the channel and should swing trade price towards the top channel until this is violated. As a result, I have placed my projected D point at the most recent cross of the fibs with the top of the channel where the 161 % of CD converges with the 2.0 of XA. Also I have a green horizontal line indicating where price will push towards if this butterfly is not respected. Further more, the purple trend line that is running across the channel indicates that price is currently flagging and once this point breaks we can buy securely towards C to D.
Above we have the “major” pattern that has been causing the reversals you have pointed out. Here you will note with the first two yellow ellipses that price has hit the 1.272 of XA converging with 100% CD twice and reversed drastically. The green ellipse illustrates the reversal zone you have shown me and also points out that this is where price first attempted to break the monthly triangle. The red ellipse shows where price has recently tested this 100% cd converging with 1.272 of XA and closed above before coming to retest the support lines we have on the previous image. In addition, we now can see the butterfly that is developing near the green horizontal line where the 1.618 of XA converges with the 127% of CD. Please note that the BC leg is a .382 indicates that price has an 80% chance of reaching this 127% CD, hence the strong uptrend.
I hope the above analysis will suffice in helping you trade this pair.
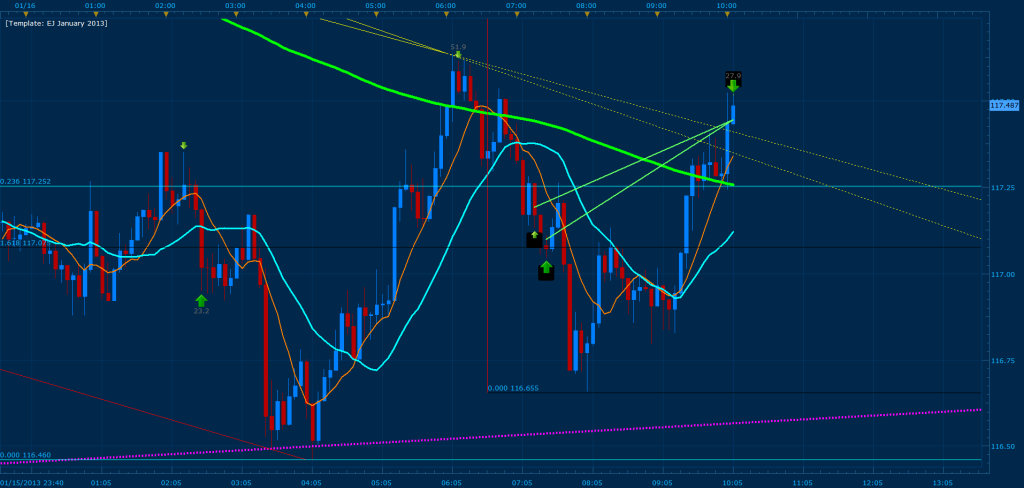
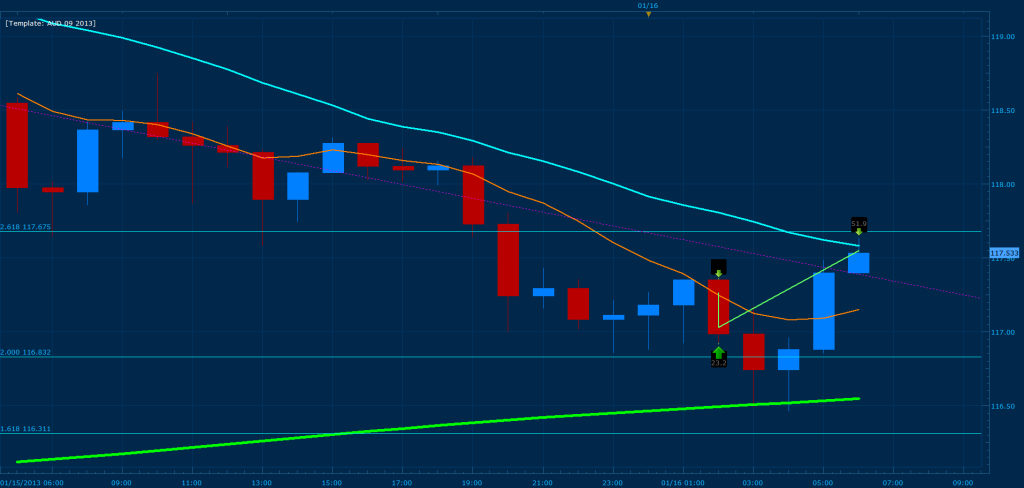
As for where my major X lies on todays Eur/Jpy analysis, the image bellow will help clarify this.
My instincts told me that I should wait for price to confirm the bullish movement on the four hour close before continuing the buy and to purchase again if price pulls back significantly for bonus profit.
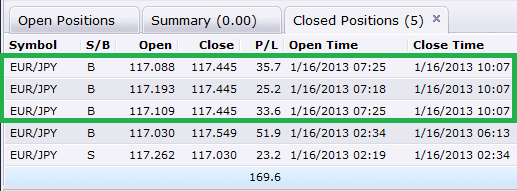
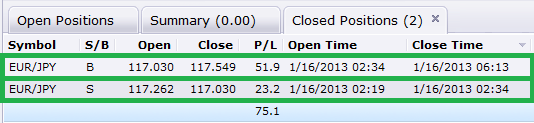
Bellow are the current results (the bearish pips where from trading C to D)
I have a few questions about the last one though. Which profit target dig you have since you made 51.9 pips out of it? Why not the usual +30 pip target? Did you have a stop loss and how big was it?
Why i’m asking is because you bought at 117.030 and price thereafter pulled back -58 pips before it went up again. Price went halvway from 1.272 to 1.618 to 116.452 below your purple trendline. How did you know the support was not broken and price would climb back up?
With a 1:1 win/loss ration you would have had a stop loss of 60 pips and a profit target at 60 pips. And if so, what “signal” got you to exit the trade at 51.9?
Sorry for asking so many question. The reason is i was with you on this trade and used a PT and SL of 30 pips. You can guess the result. I’m just curious about the “logic” behind your descission making in a trade like this.
Booked some additional profit on the EJ after the major pull back before the 4 hour close. Unfortunately I jumped in too early which caused me to prolong the trade and risk a safe exit. Never the less, the pattern has proven to be strong and allowed me to achieve and avg of 30 pips in bonus earnings (the green box in the pip image bellow). I will be closing out for today and will be available later to respond to any questions you all may have.
As always, I use visual stops when trading and I am always looking at the development of the 5 min and 1 min chart to understand current price action. Because of the fact that I use a visual stop, I put into consideration what time frame my pattern was found. For instance the XA and CD of todays pattern comes from the 4 hour chart, meaning that I must wait for a 4 hour close or significant break on the lower time frames to exit. As a result my trades are not a 1:1 ratio, you can read through the beginning of the thread and read about this trading method various times… lol. If and when I use a physical stop, its for emergency cases where price can jump 100 pips in 5 mins (meaning I only use emergency physical stops).


 I’m just curious about the “logic” behind your descission making in a trade like this.