1). It is a US Bank holiday
2). Their is major JPY news coming out this evening.
3). Price has began to form a bearish channel.
4). YEN statements (My mentors sent me the following statements through e-mail so I’m sure its worth a read if you guys have not checked out Bloomberg):
Bloomberg: Jan. 20 (Bloomberg) – The Bank of Japan will need to slow monetary easing if the effects on prices and the yen go too far, said Koichi Hamada, who’s advising Prime Minister Shinzo Abe on choosing a new central bank chief.
Policy makers are “working hard to raise prices and influence the yen,” Hamada told reporters today. “If it goes too far, it should be stopped,” he said after appearing with Economy Minister Akira Amari on an NHK television show in Tokyo.
Investors are gauging how far the government may let the Japanese currency slide after Abe’s pledges of aggressive fiscal and monetary action triggered a 10 percent decline against the dollar from mid-November. They got mixed signals last week, when Amari highlighted harmful effects of an excessive decline and then said he had been misinterpreted, while Hamada said 110 yen per dollar would be “too weak.”
“It will be difficult for the BOJ to slow its easing, but those concerns are still far away,” said Tomo Kino****a, chief economist at Nomura Holdings Inc. in Tokyo. “They need to concentrate on getting out of deflation, and we can worry about inflation later.”
The yen slipped 0.2 percent to 90.10 per dollar last week in New York and touched 90.21, the weakest since June 2010.
It “won’t be easy” to slow monetary easing when it becomes necessary, said Hamada, a retired Yale University economics professor who taught Bank of Japan Governor Masaaki Shirakawa at Tokyo University.
Fiscal Stimulus
The government is trying to shake off entrenched deflation and drive a recovery in the world’s third-biggest economy. All 23 economists in a Bloomberg News survey expect the central bank to expand asset purchases at a two-day meeting that starts tomorrow, with a median estimate for a 10 trillion yen ($111 billion) increase. Abe already unveiled a similar size of fiscal stimulus.
The Nikkei 225 Stock Average gained 1 percent last week, while the broader Topix Index capped its longest weekly winning streak since 1986 as the slide in the yen aided exporters.
“Abenomics has worked so far on the stock market and the yen just through announcements,” Hamada said.
Japan last had 2 percent annual inflation – Abe’s new target – in 1997, when Toyota Motor Corp. unveiled the Prius hybrid and the yen sank as low as 130 per dollar. Amari told reporters today that a planned joint statement from the BOJ and the government won’t set a time period for the price goal and won’t call it a “long-term” objective.
Inflation Target
“The BOJ will do what it has to do to reach a price stability target of 2 percent,” Amari said. “The government has a responsibility to do what it has to do to achieve growth and fiscal consolidation” to prevent a loss in confidence in the nation’s debt, he said, adding that “both sides are coming closer to agreement.”
Vice Finance Minister Shunichi Yamaguchi said last week Abe’s administration anticipates the BOJ will adopt the 2 percent inflation target. Finance Minister Taro Aso said Jan. 18 the bank and the government will issue a joint statement after the meeting.
Abe’s in the process of narrowing down a list of candidates to replace Shirakawa, whose term ends in April, Amari said, reiterating that “international communication skills” are a requirement.
Amari stoked a two-day gain in the yen last week after flagging the danger of the exchange rate getting too weak. He later said his comments had been misinterpreted, telling reporters that the yen is still correcting from excessive appreciation. Hamada said Jan. 18 that he wondered whether he should be advising Amari on the issue.
The nation’s currency policy risks fueling trade tensions. President Barack Obama should tell Japan’s new government that the U.S. will retaliate for policies aimed at weakening the yen, a group representing Ford Motor Co., General Motors Co. and Chrysler LLC said last week.
To contact the reporter on this story: Andy Sharp in Tokyo at <[email protected]>
To contact the editor responsible for this story: Paul Panckhurst at <[email protected]>
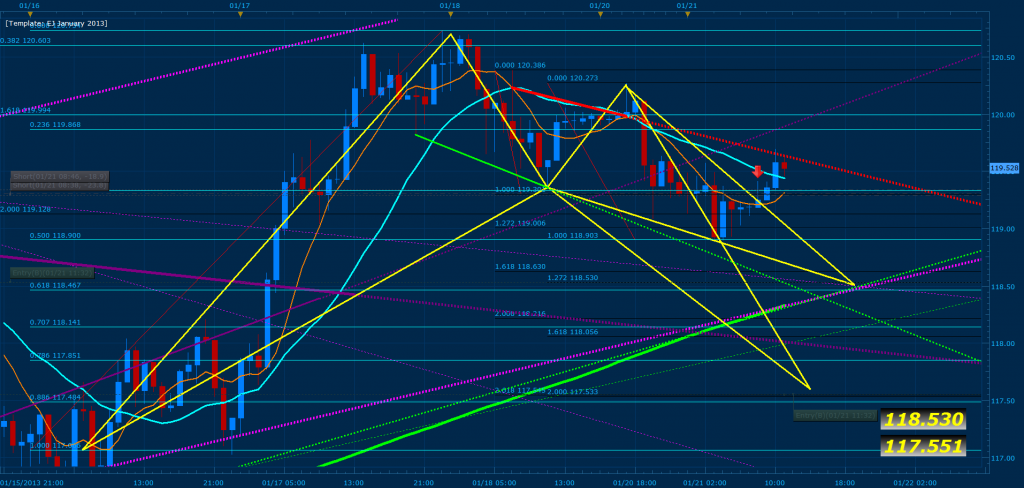
Above are two developing Gartleys on the EUR/JPY; the first convergence is found at 118.530 of price where 161% CD of the first swing and 127% CD of the second swing converges with the .618 of XA when using the bottom MVA curve of the hourly. The second pattern is projected to reach the extreme of 261% CD and 200% cd respectively converging with the .886 of XA. The first pattern mentioned should hit the bottom of the 8 hour channel and push price with an 85% chance towards the .382 of AD. On the other hand because of the fact that today is a bank holiday and the Yen will be releasing heavy news we should expect price to reach the extremes, even if the first pattern where to work. Further more you will note that I have various color coded lines: Green = standard low to low extremes of price trend lines, Purple = MVA support/resistance trend lines, and Red = current high to high average. In effect, the green and purple trend lines are working as a “net” for price and adding towards the convergence of the illustrated patterns (if the “net” where to break on the 4/8 hour charts expect the new down trend to be confirmed and price to take a nice dip). In addition if a significant break occurs on the red line, I will expect price to form patterns around the previous C point (If C where to break then you should definitely expect price to reach or break the highest high before entering into any shorts). Please note that the reason the current down trend has developed is because the exhaustion bar formed on 01/17/2013 triggered a monthly pattern which has a 95% chance of reaching 114.408, 85% chance of reaching 110.509 and 70% chance of reaching 104.205 (simply keep these price zones in mind if the new trend becomes a reality or place a thick horizontal line each of these price points on your chart). All in all, I will be following the development of this pair and will keep you posted with its development throughout the week.


 Thank you for making me feel a little more secure about the transaction!