Wow, that is one thorough analysis. Thank you very much!
TMB,
What an analysis, thank you very much. You started something now… how do you predict the likelihood of outcomes as you do?! I’ve never seen that before, very interesting stuff.
Thank again for the awesome post,
Cheers
…and I think I just figured it out, that’s the 23.6%, 38.2% and 61.8% fibs of the big daily range 
Learning something new every day! All about probabilities and letting it work in your favor.
Thanks TMB.
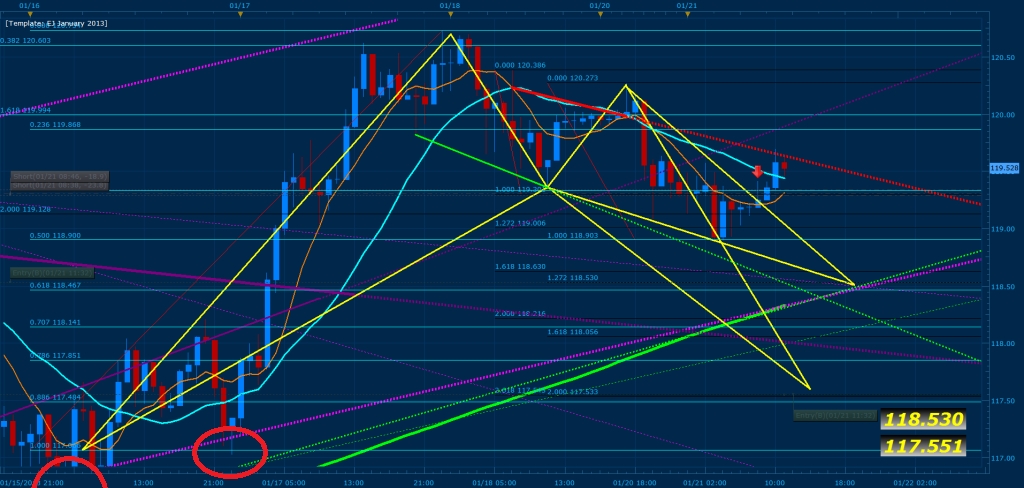
Last question for today, what pattern would that be? I can see that price is currently stuck between the 50% and 61.8% retracement of the weekly chart but as far as candles go I can’t really see any reversal signs/patterns yet? What are you looking at?
Thanks man, take care.
Great analysis TMB! Thank you very much! The way you use the combination of trend lines, fibs and MA’s is impressive! Keep up the good work. Personally i am learning a lot from each of your posts every time. I can just imagine how much the guys who have been following you on this thread since the beginning must know by know! 
TMB and Everyone,
Could anyone explain me why you didn’t use the lowest price of the swing for X, the price at the half circle that I made on the following chart?
When you start draw the fib, isnt that you start at the lowest point of the candlestick? When I look at the full circle that I made, you started a bit higher than the lowest point of the candlestick. Did you intend to start a bit higher? If so, why did you do that?
Thank you very much.
TMB,
I’m reading this thread from front to back now, but I check the most recent posts once in awhile to help learning patterns in the current environment. I’m sure this was covered somewhere in that 4 year time span of posts, but I’ll ask anyway.
You seemed to be doing quite well or at least hitting your 30 pip target fairly well with just the use of Fibonacci’s and retracements. Where are all these additional indicators, such as in your most recent post coming from? Are they really boosting your hit rate from when you first started? I’m sure the indicators are all crystal clear to your trained eye, but it looks like chaos to me. Did you introduce these extras one by one?
If these patterns are supposed to be 70-80% accurate, then why is it that half the time or more it doesn’t work out as it’s supposed to? Case in point, TMB mentions several time periods during the day when there are ‘fakeouts’ and you shouldn’t be trading…does this mean if we include these times into the averaging then these patterns are only about 50-60% accurate more or less? I only ask because I’ve been following the rules, looking for the best convergence, and with an eye on collecting max 30 pips on a trade, but at best I am breaking even. I do not find my trades nearly as consistent as others report. Any thoughts on this? Help please!!!
They don’t work with that type of win rate unless there is manual discretion involved.
I don’t understand. You mean 70-80% accuracy is a lie? What’s the accuracy of this trading system then?
I wouldn’t call it a lie. When trading a system, you will discover that various people end up with various results. This is primarily because there is a certain amount of manual discretion used for each individual trader.
Yes, but this system is pretty specific as to when you should enter, exit, etc. So if you merely draw the fibs and enter at the closest convergence, then why doesn’t it appear to payoff as often as people say harmonic patterns do?
Harmonics is specific to a certain point but you must consider other factors. Just because it reaches this fib level does not mean it will agree totally. Have you read Scott Carney’s book? If you are looking for point D, point D ranges. The PRZ can be a small gap to a large gap. He showed various examples of how price can test the PRZ levels. There are supposedly 3-4 levels but I use levels from what the harmonic pattern gives. I have been in several trades where I once thought that price would retrace after hitting one of the levels and just retrace but no. It retraced 10-20 pips (lured me in) then dropped to the 2nd or 3rd PRZ levels. Be careful how you analyze these patterns because they are tricky. It is not all about drawing triangles as I thought ;]
Scroll back few pages and you’ll find a detailed explanation. When drawing the first fib from wick to wick (X to A) does give you confusing results, you can test to draw it from the base pf the candlestick (X) to wick (A) or from the 8 MA (X) to wick (A) to see if you get a better result (convergence).
Because the sad truth is that the majority of people stay bias in market direction and on top of this do not do a full top down analysis of the markets that they are trading. To clarify, when you draw any given pattern you will 9 times out of 10 find that there are multiple convergence zones reflecting 3-6 different D points where the harmonic pattern may develop. As a result if you do not have other factors that help you pinpoint the correct location of the D point then the “AVG” percent rate will be meaningless. If you look through all the patterns that I draw on this thread I always have something that is adding towards the convergence zone of the pattern (usually 3-5 additional signals that indicate the buy at that specific zone). In addition, history has proven that once a true D point is triggered it has a 7/10 (70%) chance of completing a .618 retracement; the reason I have shown higher success rates then this is because the majority of my patterns complete before even reaching a .382 retracement and I have noted that price tends to test the .382 80% of the time when completing a “true” D point. If you have not done so, take time to go through the thread and each post carefully… you will find that I show both the success and failures of this system and the reason behind each cause.
The rules stated where created to keep one disciplined in this trading style. Yes, it should always be considered when conducting a harmonic trade.
Good morning everyone! (+1 GMT here) 
Earlier in the post TMB mentioned a few attached pdf files to this thread. When i try to load them i just get an error message regardless which computer i use. Is there another way to get access to those files?
Refer to the following quote and click on the little arrow next to my name if you would like to learn a bit more about the technique I’m applying to harmonics now:
I attached to this post the “Trading Checklist”, “Rules Of The Trade”, and “Preventing Fakeouts & Analyzing a pair”.
Note.: these are in PDF format and you will need adobe acrobat reader to see them if you do not have it go to Adobe - Adobe Reader download - All versions I would uncheck the free antivirus promo if you already have one.
Trading Checklist.pdf (10.1 KB)
Rules Of The Trade - By TMoneyBags.pdf (22.4 KB)

