This was on 5% risk. You definitely need to be on the defensive with that size and cut a loser asap. Then I just stuck to my conviction of direction and rode it out to my targets… cut your losers, let your winners run… sounds familiar
Gotta say though, that the 30 pips profit target is a very good idea if you don’t have strong conviction of bigger trend direction or if you are going counter-trend.
How do you determine if it will be a looser that quick? Fakeouts can turn around really quick and shoot away into the wrong direction like a bullet…
Thats why i use physical stops. But either way you seem to do a really good job!
What i ment was i will have to decrease my TP target to just 20 pips instead of 30 since i always seem to get stopped out due to wrong entries, maybe becuse i cant switch between bid/ask. No clue…
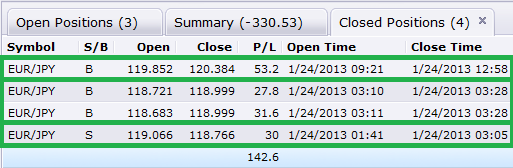
So the EJ missed my sell entry by 2.5-3 pips… but that’s ok because I made 53 bonus pips towards C to D :). I’m done scalping the market for the day, but have now added the 60% of my max lots that where freed up towards the extremes of the UJ to form a hydra.
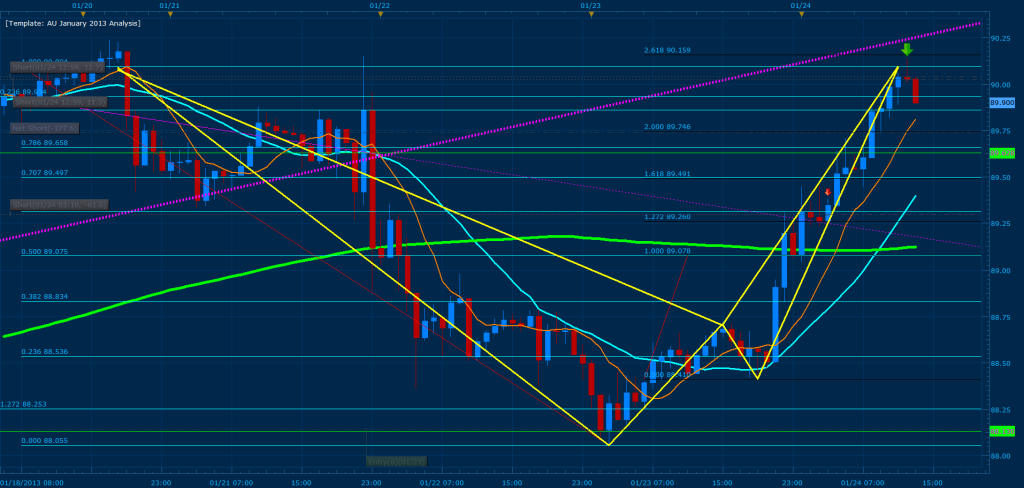
Bellow we have the USD/JPY triggering a bearish gartley at the extremes of price, where 261% CD converges with the 1.0 of XA when using the top of the hourly 8 mva curve (The pattern can also be noted on the four hour chart.) Because of the fact that this top has previously worked as a major resistance zone (price has been violently swing across a 183 pip range), I will be taking these shorts towards 88.130. If price action shows trouble breaking 89.628 I will most likely break even with a small gain in profit on the pair and search for another pattern to trade.
Well I think I phrased it wrong. I wait for a close to confirm the trade was wrong OR for it to really soar past the -30 pip mark and then I close it. Like TMB I’m playing with no physical stop right out the gate except if I step away, then I always put on a 30 pip stop. What I further meant was that I don’t keep on trying on a level if I got stopped out once, I take that as a sign that I can get back in again at an even better / extreme price.
You know that trade we had on the 22nd January where price reached down and just exploded off the pre-determined price levels? That’s what I’m looking for. If price doesn’t do that, I most likely rather bail on it. Still learning a lot as well, but I’d rather play it defensive and go with the real winners that works right from the start.
I totally agree with you. For example the EJ trade today was a real slow one. Price hit the 200% lvl, continued for a bit and THEN retraced slowly downwards. But my trade got triggered 13 pips before price turned around. When i was 3 pips from my TP lvl it turned again and stopped me out.
But hey, there will be many many more great setups in near future!
My biggest problem is that i do not have time to watch the market which i would love to do. I have to place limit orders instead and they are fixed an not adjustable when you’re not in front of the comp. And when your entry points are not spot on you must hope that price retraces further then the 30 pips TP.
I’ll try with 20 and see if i get a higher success rate. Because many of my failed limit order trades would have been positive with a smaller TP range.
Could’t get myself to move away from the computer. Somehow i love starring at these diagrams, maybe i should seek professional help…
Price shot reversed through the resistance up to 90.540. What do you think, how will it continue? Since Japan is stimulation the financial market a lot at the moment with billions the yen should get weaker for some more days and price on the EJ should continue to rise.
What do you all make of this situation? Any ideas when this uptrend will come to an end?
Hello, everyone! I am very new here and I wish to say that I like a lot this Thread.
Well I have a question. Did I spot the D-point well? I know that my setup is going beyond the weekend(and I don’t know that if it will affect the Butterfly) The time is GMT+2.
You said you started X at the highest point of the MVA cure on the 4 hours chart. But Looking at the chart, I see that this X point would be at 120.021. But in your chart, you started at around 119.762.
Do I miss something here? Could you please explain me how you chose this X again?
When I go to the 1 hours chart, and I tried to draw from under the lower point of the MVA (yellow circle), I got the same as yours. Did you make a mistake draw from there?
As you said, you draw the X from the highest MVA on the 8 hours chart. Why do you draw X on 8 hours chart when the pattern can only be found on the 1 hours or 4 hours chart? and not on the 8 hours chart?
Had a 15 minute coffe break and used it to scout the different pairs. Not seeing anything on the most common ones at the moment. My limit order missed a good bearish gartley trade on the GBPJPY 30 min.
Found a bearish gartley on the GBPCHF 30 min. Price is still moving downwards though but if it changes direction theres a good convergence at 2.000/0.618 which also is a previous resistance/support level and a trendline drawn between the 8/20 MA crossing on the 1H cuts right through the convergence.
Not sure if i wanna trade it though. My broker has a 8 pip spread on that pair.
Whenever I draw my Fibs, I make sure that previous price has respected the current fib zones. This in effect allows me to exit quickly when using visual stops at the break of a fib or place my physical stop above a fib point that should be respected. It also allows me to trade C to D with ease while finding true convergence points; when I use the X using the info provided from the 8 hour chart, you note that price respected the .382 and .236 of price (channeling within it and creating a flag, before breaking the zone and continuing the up trend). In effect, this is part of what allowed me to find the setups I placed yesterday… remember when I booked the 30 pips on the short and reversed positions immediately for another 30 pips because of price action?
XA is simply a measurement that allows you to pinpoint the development of a true ABCD with accuracy and as long as its above the C point, the measurement is valid no matter what time frame you are using to reflect its position. In effect, what defines the time frame of a harmonic pattern is where I can first clearly see the ABC swing with symmetry; starting from the highest time frame that it is visible.
Hi TMB, can you please give a graphical example of how you determine whether price has respected current fib levels and what determines current fib levels? I’m a little unsure what you mean.
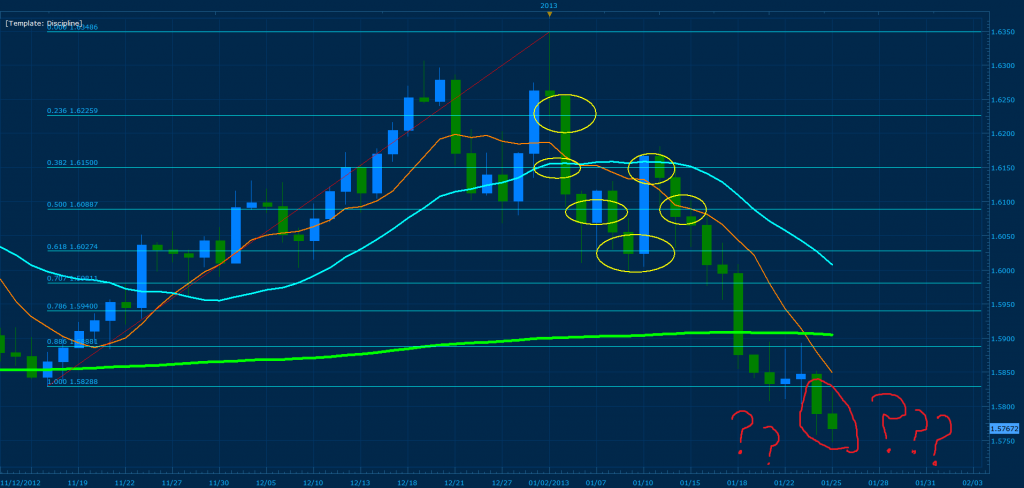
Lets start by examining the GBP/USD Daily chart and drawing our fibs from the most recent extreme X which lies at 1.58288. Each yellow ellipse here indicate that previous price history has been dis respecting the fibs by either not respecting them at the initial hit or faking out once breaking through the support/resistance zone. As a result we are baffled as to why price is slowing down and halting from an unknown source… hence the ??? in red.
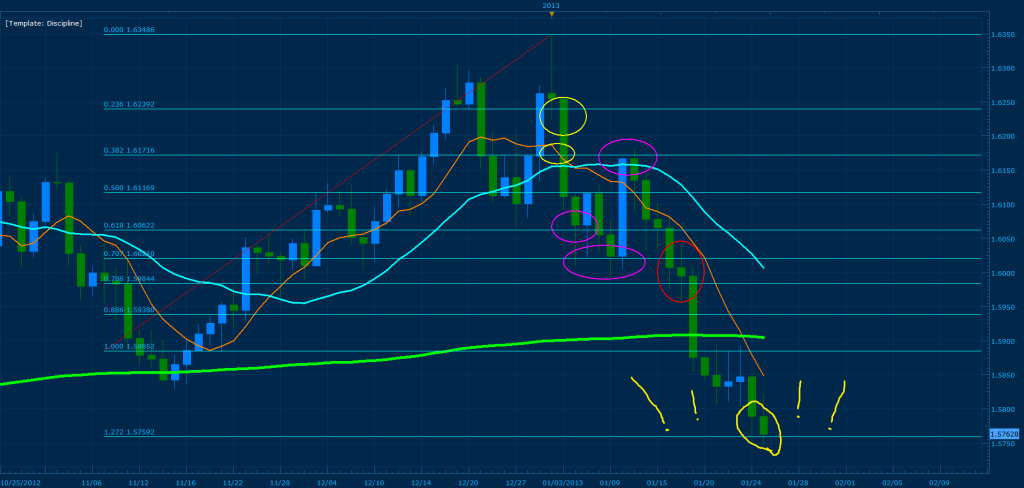
Now when we draw our fibs from the mva curve (base price) instead of the extreme point we notice that price begins to respect the fibs. Initially price breaks through and disrespects the first two support zones illustrated by the yellow ellipses. But then price begins to halt and respect the major fib points and retest the previous broken zones illustrated by the violet ellipses. The red ellipse here shows that after breaking the major support zone price gave us three days to jump into the continuation of the short by retesting on the second day and turning the point into a major resistance zone. Note that once price breaks the 1.0 at 1.58852 price slows down and retests the break confirming continuation with halts. Finally we reach the 1.272 extreme and can see why price is currently halting; here its either hit a D point for the reversal or is waiting to break and push towards the 1.618 of XA.
I’ve made my first live account after trading demo for a month. I’m only trading 0.01 lots so it’s really just to get the ‘feel’ of live trading. I’m really interested in understanding this trading style here, but not sure where to start, I’d really like some guidance in understanding what you are doing. I’d be extremely happy with 30 pips a day.
Start by reading the first 200 of the thread. Then once you get a feel for it, continue reading until you can understand the current topics :). I’m sure you will find the majority of your questions answered within the first 300 pages.