continue for the post above for the image…
The big picture is following

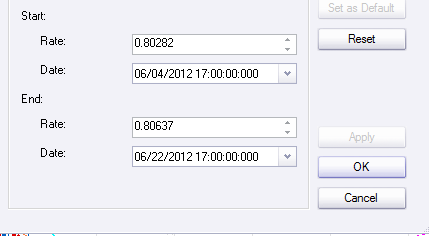
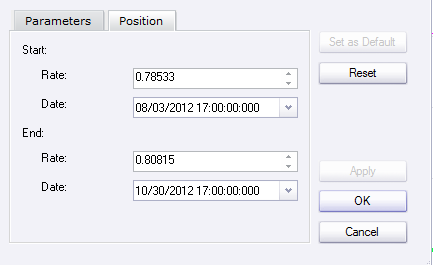
When I try to re-do this pattern. I believe you have the second fib was not at the right place. So, in the above image. I try to use the correct fib. If you could please double check it.
as a result, there is no real convergence at where you told us.
Thanks
Hi TMoneyBags, thank you very much. I am studying it now 
Hello Everybody.
TMB, thank you for sharing your system and for the market analyzes you post here.
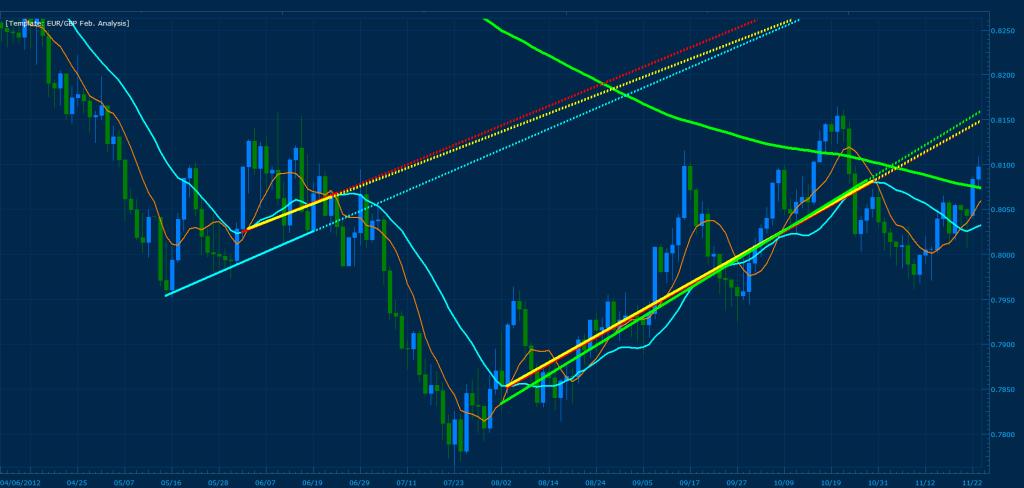
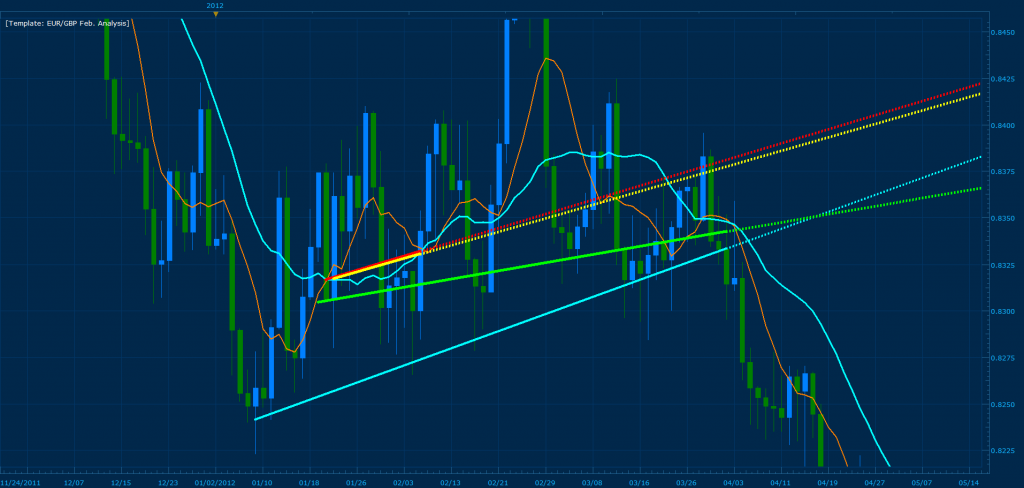
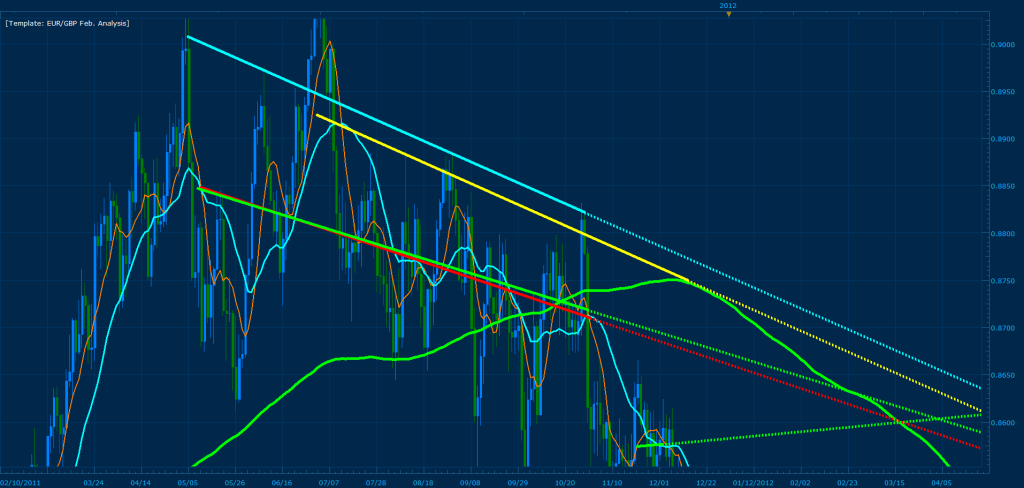
Here is my homework with trend lines EUR/GBP.

The first ascending trendline from the bottom drawn from the lowest point (08/06/2012) of crossing of 8 and 20 MVA to the highest (10/31/2012). Second is the line of support drawn with Low from 5/15/12 to 6/19/12. The highest ascending line is also line of support that was holding the price from 1/09/12 to 4/02/12. And the last one is falling resistance line drawn with Highs from 05/05/11 to 10/28/11.
Will be waiting for your analyzes to see if I was right with these trend lines.
Also can someone explain me, please, why the image I’ve posted here is so blurred and how to post clear images.
Alexaz972 = Cyan Trendlines
Shonick = Yellow Trend Lines
Diablo1505 = Green Trend Lines
TMoneyBags = Red Trenlines
If your name is bellow the image, that means that you are using the same MVA crossings I’m using for the MSRT’s

For the Bottom MSRT: Alexaz972 Shonick Diablo1505, For the top MSRT: Shonick
Shonick
Diablo1505
Alexaz972 It is interesting to see that even though you did not use the MVA crosses for the majority of your analysis, that you came in the closest in “pip difference” between my MSRT’s and yours when price actually hit the trend lines. To clarify if I where to look at price past and before the current zones that where hit, our trend lines do not have the same convergence (obviously because they where not drawn from the same points). This in effect proves that the combination of both techniques can predict price reversals and major breaks in the market. In addition, I believe it can also be used to swing trade price when the points separate.
Diablo1505& Shonick Thank you both for your contribution on this thread and for taking in the time to thoroughly analyze the markets, because of your combined efforts I will post my entries/exits and reasons why I enter/exit the market for the month of February!
Currently I am waiting to see how price closes on the 4 hour before entering into a trade (the next 15 minutes). It seems as though price is creating a morning star off the convergence it has currently reached for both the EG and EJ.
Signal: 124.903 Bearish Gartley Triggered EUR/JPY Posting Analysis shortly
Here we have a bearish gartley that has formed on the EUR/JPY 1H chart where the .382 of XA (using top highest MVA curve of the hourly) converges with the 127% CD. In addition, the convergence crosses with an MSRT zone from the 8 hour (pink trendline). The red trendline is an hourly MSRT and will by the maximum length that I let price run (If a break where to occur I will close out half or all lots and attempt a sell at the touch of this trendline). The yellow trendline indicates where my “final short entry” would be placed and a break of this zone along with the red trendline will mean that the current MSRT that is being tested as resistance will turn into support and push price towards the 128 level. All in all, the 4 hour has closed bellow this current convergence zone and I expect price to reach my target for 90 pips (green horizontal line at 124).
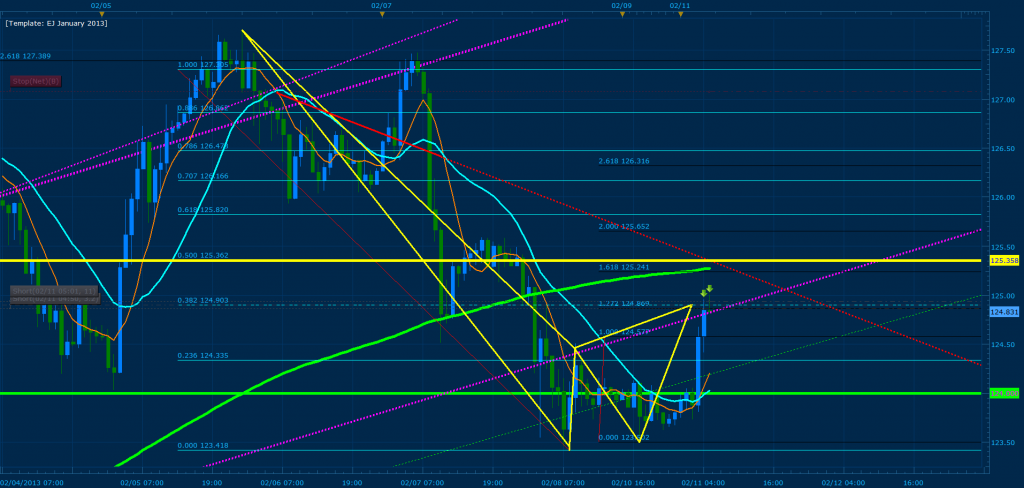
[B]Final short position at 125.291 has been triggered. Exit will be a close above 125.358.[/B] If the 8 hour closes above 125.358, expect price to reach 128 level as stated previously.
I personally use the snipping tool (a windows aplicattion you can find for default on windows 7) for taking the screenshot, and then I upload it on imageshack or photobucket.
hope this helps.
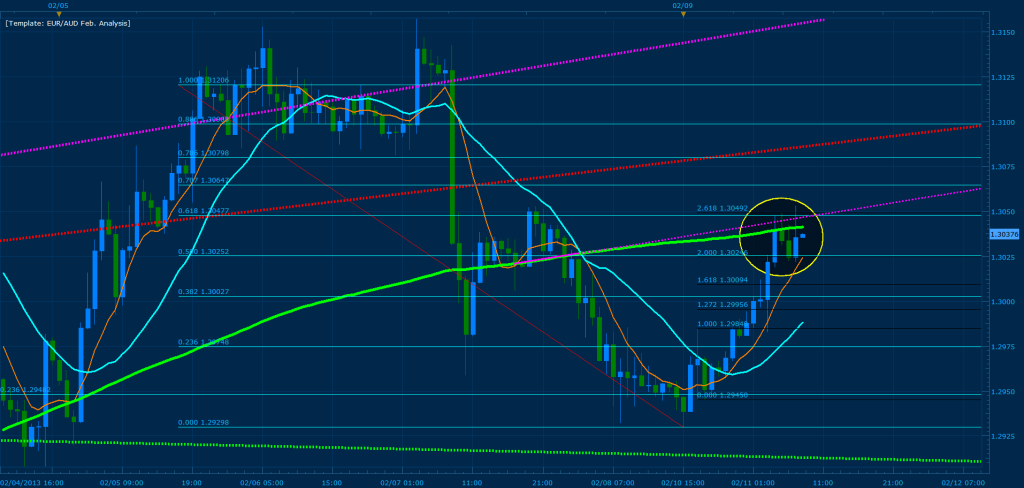
Currently the EUR/AUD has reached the extremes of 261% CD converging with the .618 of XA, I like the wicks that have been developing on the hourly off this zone and the developing pattern gives strength towards our bearish analysis of the EUR/AUD (see the February analysis from last week). A break of the convergence will push price towards the wicks of the previous high. I’ve entered the short towards 1.29682… Cheers 
In market scope press ctrl+alt+P and it will save a screen shot of the market as a .png image which can be zoomed in and out without breaking the pixels. Then you can use photobucket.com to post your images here as I do.
Hi TMB,
thank you very much for your analysis of our homework, i appreciate it! 
A fun way to learn, feels like going to school again. And thank you for the analysis and patterns on the EURJPY and EURAUD.
Just have one quick question. You said you’ve entered the short on the EURAUD “I’ve entered the short towards 1.9682…”
A bit confusing since price atm is at 1.30277. 
1.29682 was missing the 2 sorry for the typo 
Ahhh, then it makes more sence.
Weird that i didn’t figure it out myself. Thanks!
As another sign of confirmation it looks like the EURJPY is creating a head & shoulder formation on the 15 min chart.

I understand that MSRTs only have worth if they show signs of being respected, but I’m still not seeing what signs of respect there are for the descending line in the homework assignment. It seemed to do ok back in May, but since then, price dropped well below, and even on the rise up it did not stall when it was attempting to cross that MSRT. How can we have any confidence it will be respected on the way down?
Booked profit on the pull back at 124.743 for the EJ and re-entered Partial positions at 124.860. If price touches 125.0 or breaks 124.751 I will enter additional positions. Price is currently testing the MSRT zone for the short…
TMB, thank you for checking our trendlines and for posting your trades!
I could not find the right points of crossing of MVAs to make my lines the same like yours so I used resistance and support trendlines. After you pointed where they supposed to come out from, everything became clear for me. Thank you for the lesson!
You’ve stated that to find MSRT we have to use 8, 20 and 200 MVA. Could you tell how to use 200 MVA?
Paw3000, thank you. Definitely will try.
I entered a bit late on the EJ and placed a TP at the 50% fib of the AD leg. It was a limit order since i was at work. Would i have been able to watch the market i would have seen price struggling at the 0.382 lvl and failing to close below. Then i could have exited the trade with a fair amount of profit. Now instead i got stopped out and i had my SL at 1.25400. So instead of a good trade it turned into a loss. :-/
I really wish i would be able to watch the market in real time. Would deffinitely lead to more profitable trades for me. Of course another contributing factor was that my TP was a bit too optimistic and i should have considered the topoc of this thread a bit more…
What do you expect price to do now since it has broken the levels you mentioned?
In my opinion we have to see a major reversal pn the EJ soon. We are getting close to a major resistance level on the weekly chart and the pair is heavily overbought on the RSI.